
Life expectancy in the U.S. has declined almost a year from 2020 to 2021, which was preceded by another 1.8-year drop in 2020, according to CDC data. COVID is one of the driving factors of the declining life expectancy rate with 1 in 8 deaths being due to COVID in 2021. Although life expectancy in the U.S. has improved significantly over the decades, it currently sits at its lowest level since 1996.
In light of the U.S. life expectancy decrease, we sourced CDC data to see how life expectancy differed on a state-by-state level. We also took a look at life expectancy rates between men and women in each state and uncovered which states experienced the biggest changes in their life expectancy. We hope this data will serve as a reminder of the importance of securing life insurance and preparing for life’s unknowns. Keep reading to view our findings.
Where Are Americans Living the Longest?
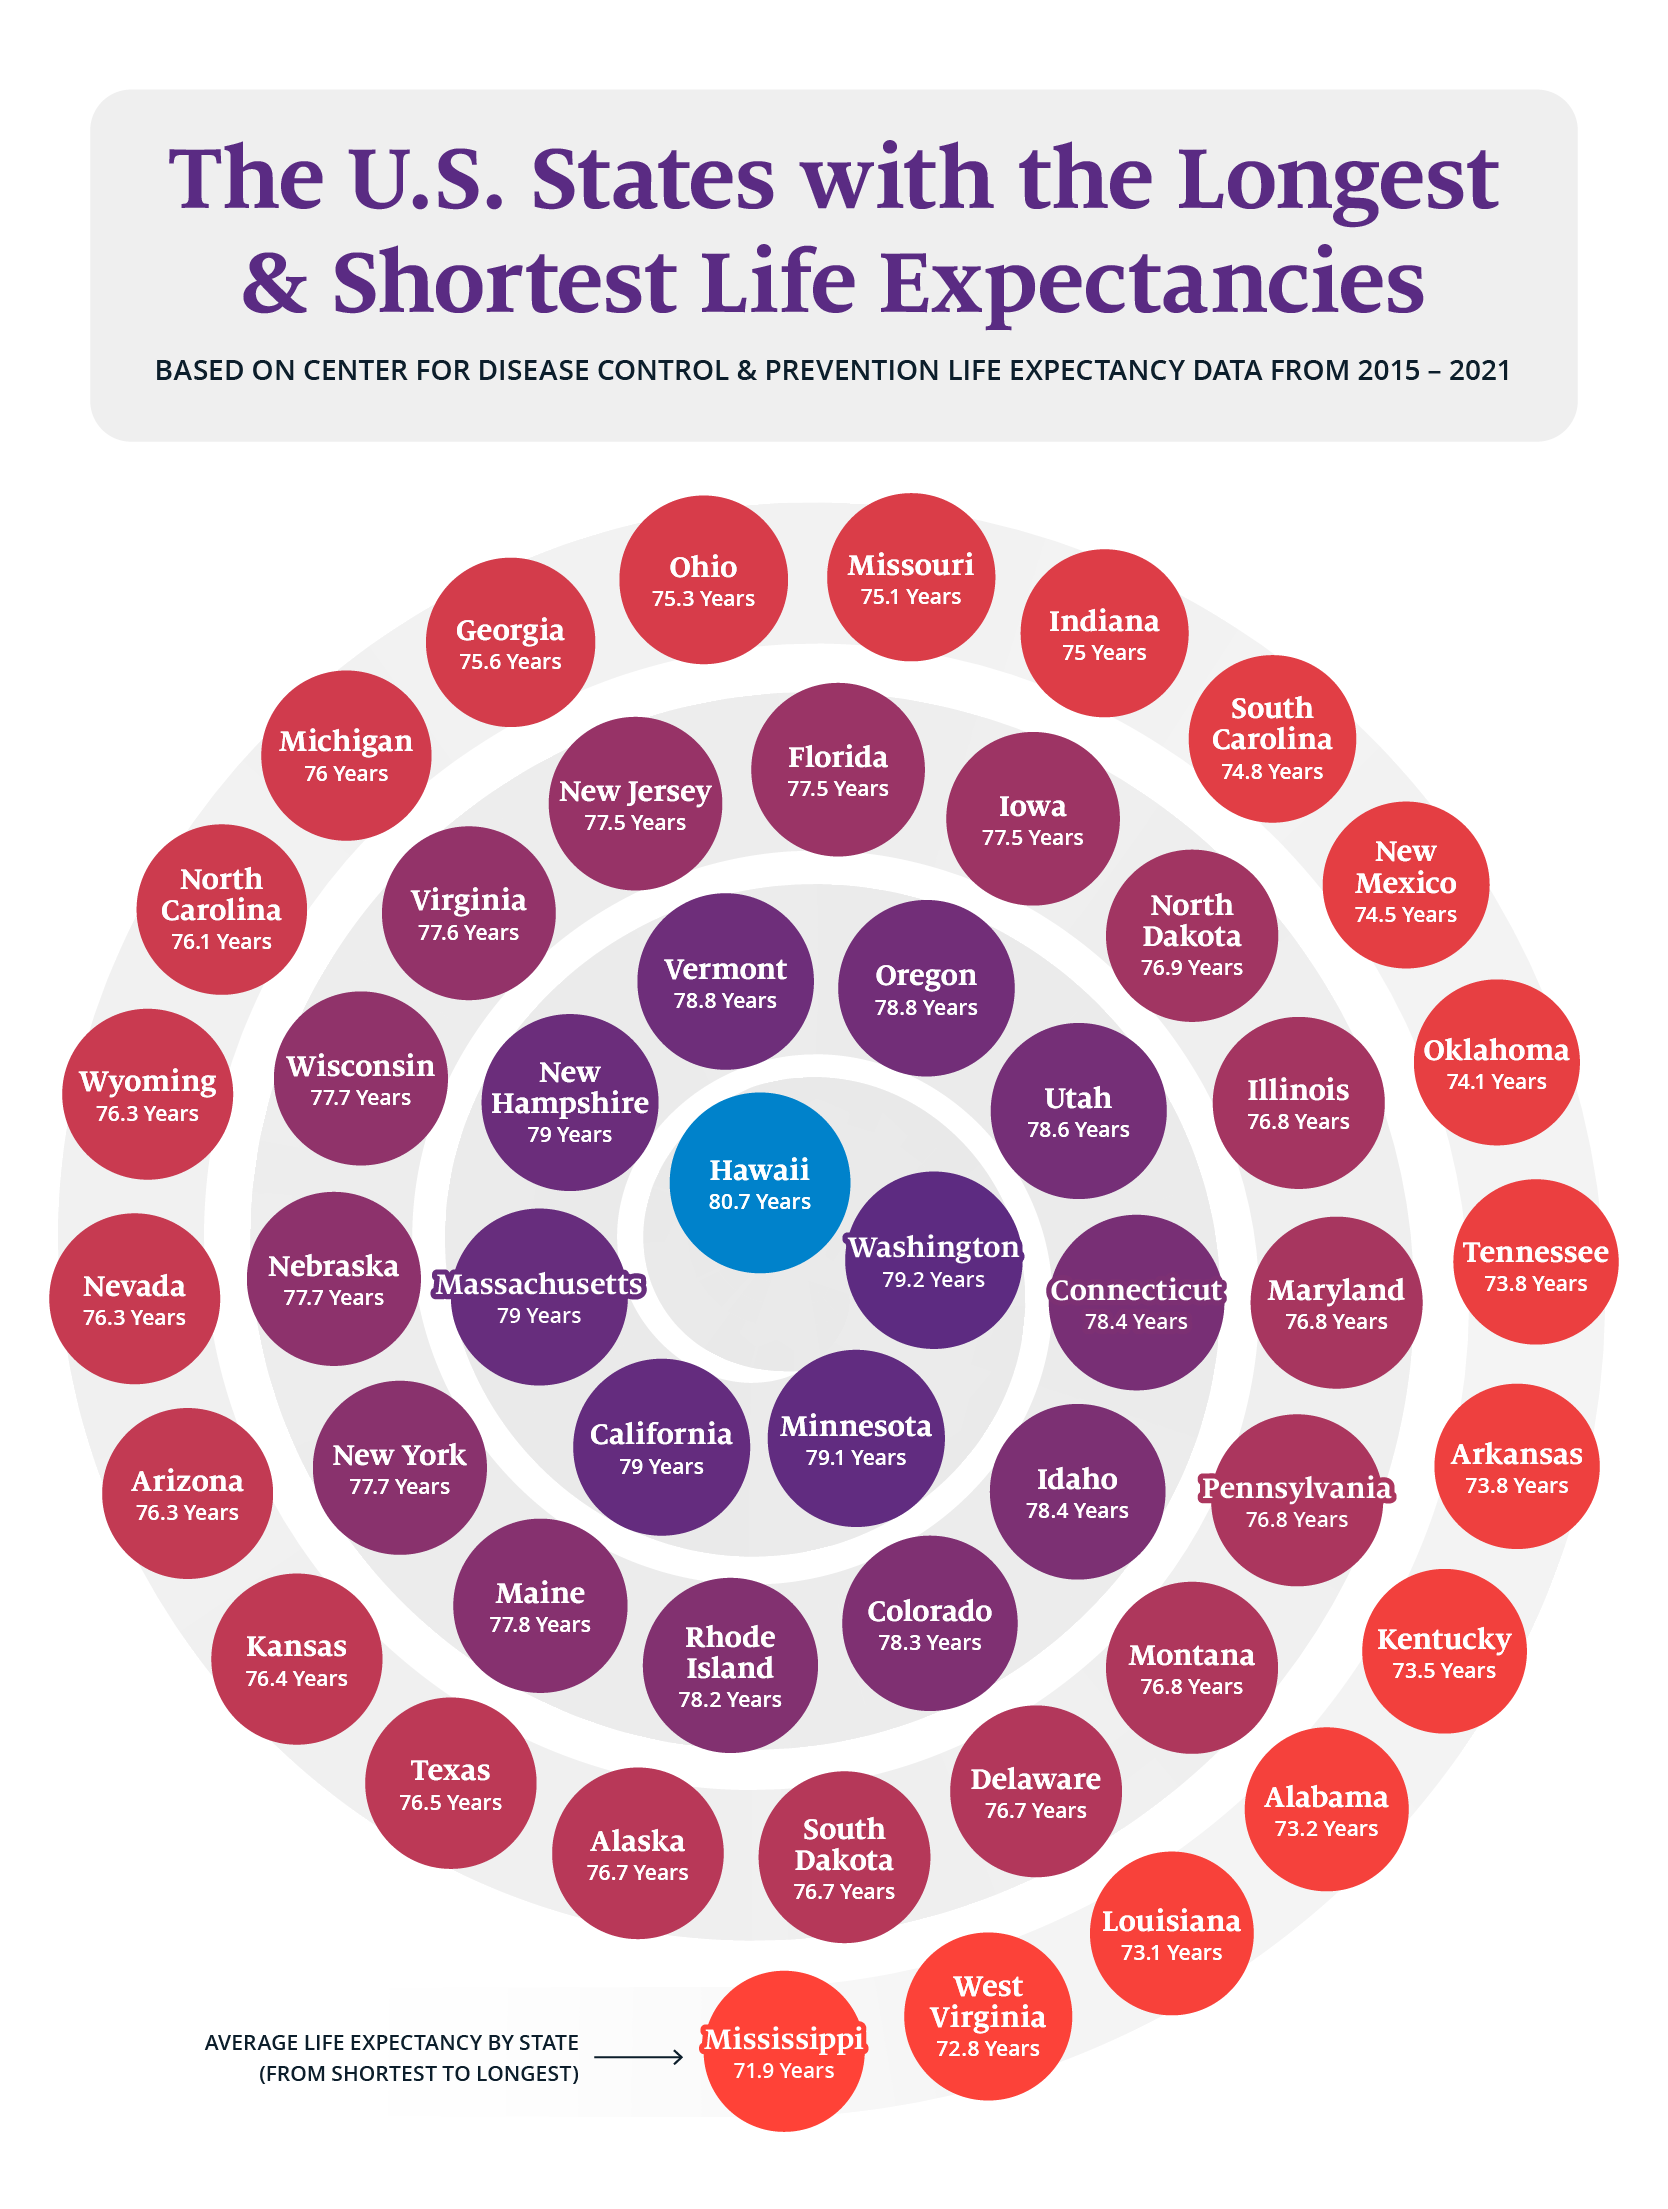
When it comes to the average life expectancy by state, certain places experience a higher rate than others. Hawaii’s life expectancy outperforms every other state on our list with residents of Hawaii living to be roughly 80.7 years old.
Hawaii experiences the second-lowest heart disease death rate in the country and low obesity rates as well. Other factors that impact Hawaii’s long life expectancy can be attributed to the state’s access to healthcare, temperate weather that encourages exercise, and sunshine that gives residents plenty of vitamin D to help protect against cancer and other diseases.
Washington places second on our list with a life expectancy rate of 79.2 years. This is followed by Minnesota (79.1 years), California (79.0 years), Massachusetts (79.0 years), and New Hampshire (79.0 years).
When analyzing U.S. life expectancy by state, we also wanted to see which states had the shortest life expectancy rate. Louisiana came in 48th and has an average life expectancy of 73.1 years.
West Virginia, which has an average life expectancy of 72.8 years placed 49th on our list, while Mississippi, which has a life expectancy of 71.9 years ranked last. Heart disease and cancer were some of the leading causes of death in Mississippi.
Life Expectancy Changes Over Time
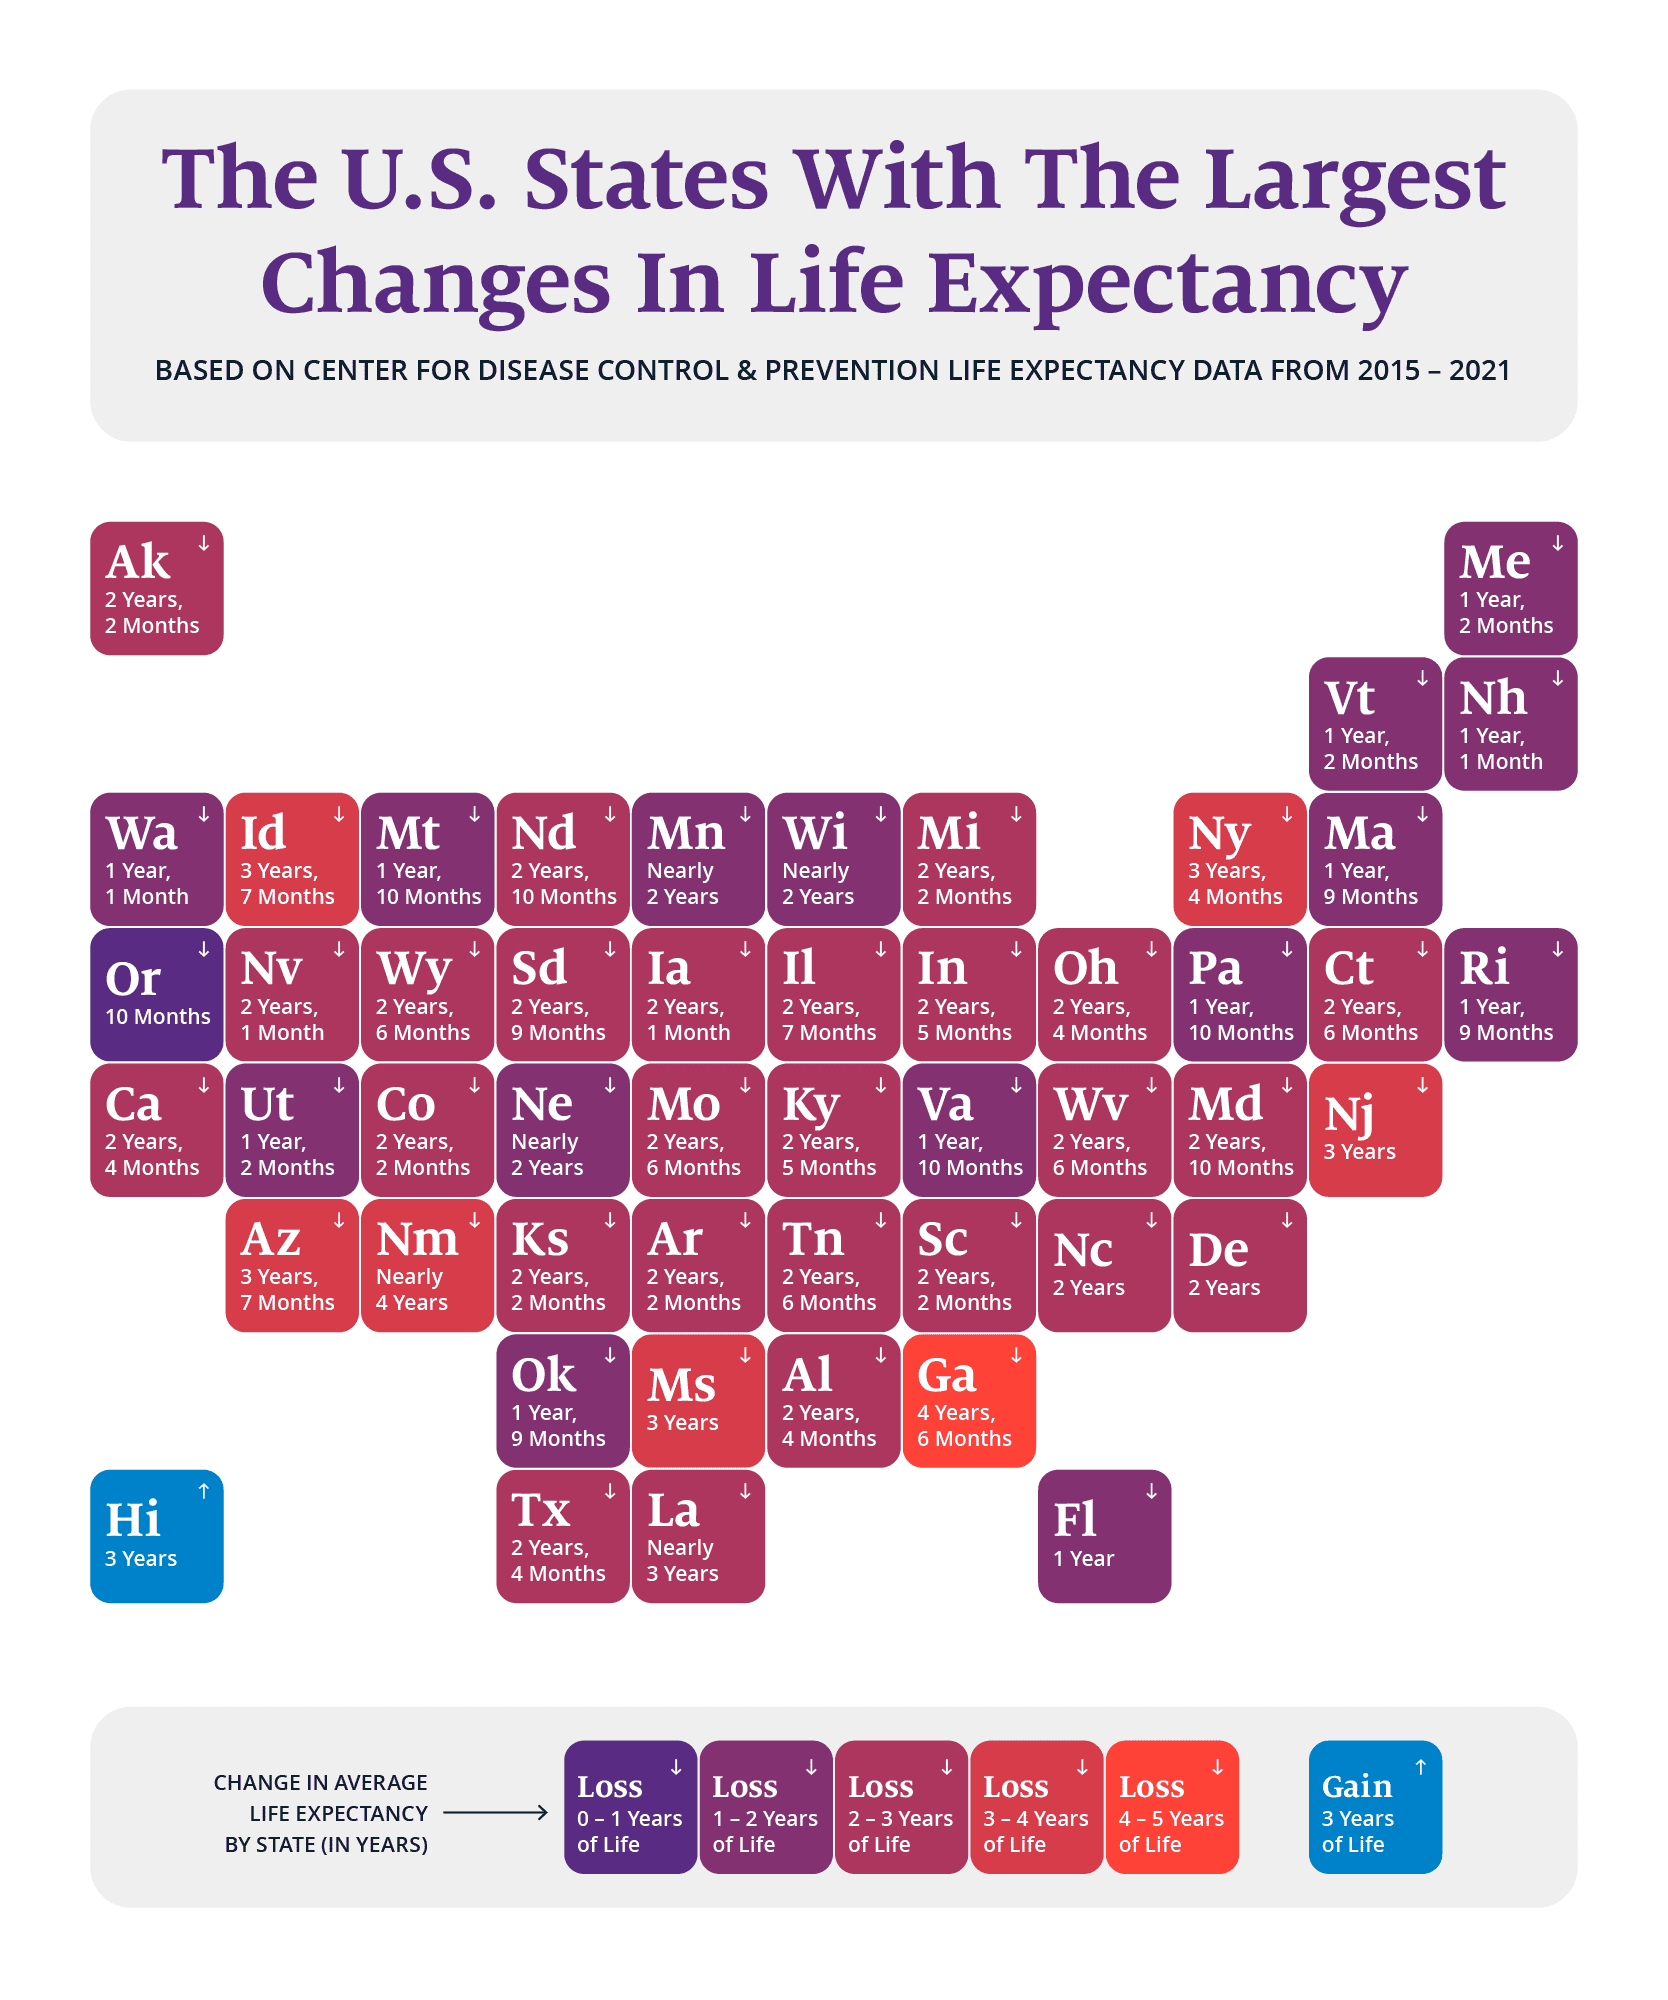
Some states have gained years of life expectancy, while others have lost them. To determine changes in the U.S. life expectancy by state, we gathered the most recent CDC data and compared it to data collected from 2010 to 2015.
Georgia had a decline of 4 years and 6 months in their life expectancy since 2015. Heart disease is the leading cause of death in the state of Georgia, followed by cancer, and COVID-19.
Next on our list is New Mexico, which had a decline of nearly 4 years. Heart disease, cancer, and accidents are the three leading causes of death in New Mexico.
Residents of Hawaii had an additional 3 years added to their life expectancy rate. Places like Oregon only declined 10 months, placing second, while Florida ranked third, with a decline of 1 year.
Other Key Findings
- Hawaii is the only state to experience an increase in the average life expectancy since 2015, while every other state has seen a decrease.
- Since 2015, Hawaii has surpassed 37 states to claim the longest life expectancy.
- Since 2015, Idaho lost its top spot as the longest life expectancy and in 2023 sits in 10th place at 78.4 years.
Life Expectancy Differences Between Men & Women
We also took time to examine the life expectancy differences between men and women. The average life expectancy of women in the U.S. is 79.4 years, while the average for men is 73.9 years.
According to Dr. Kirtly Jones from Obstetrics and Gynecology at the University of Utah Health Care, factors like stress, social networks, and overall health could all play a role.
As Dr. Jones says, “In midlife, men have more heart disease and deaths from heart disease” while “Women access health care more than men. Women are more likely to get their cholesterol checked and get regular checkups and they’re more likely to have health insurance than men.”
Find your state in our table to see the gap between men and women and check out some of our other life expectancy findings:
- Women in Hawaii (83.8 years) and California (82.0 years) have the longest life expectancy, while women in Mississippi (75.2 years) and West Virginia (76.1 years) have the shortest.
- Men in Hawaii (77.6 years) and Washington (76.9 years) have the longest life expectancy, while men in Mississippi (68.6 years) and West Virginia (69.8 years) have the shortest.
Closing Thoughts
By analyzing the average life expectancy by state, we hope to shed light on how important it is to plan for your future. While life expectancy may feel out of your hands, it shouldn’t keep you from making responsible decisions for your spouse and children like signing up for a life insurance policy. Assurance IQ can help you find a life insurance policy to meet your needs and protect your family.
Methodology
To determine U.S. life expectancy by state, we gathered CDC life expectancy data, most recently released in 2021. Next, to see fluctuations in life expectancy over time, we analyzed data from 2010 to 2015 to find how much the expectancies had changed over time. We also collected life expectancy data of men and women in to draw gender comparisons as well. Our data was gathered in January of 2023.