
As the cost of living everywhere continues to rise, healthcare is no exception. Many Americans around the country have noticed increased prices on products and services they cannot afford to cut, while others are in areas where healthcare options are limited. For this study, Assurance IQ set out to find the states that spend the most and least on healthcare and those with the most and fewest providers to determine if there’s any correlation between healthcare spending and access.
To find the states with the largest discrepancies between healthcare spending and access, we compared state health spending data from the Kaiser Family Foundation (KFF) and healthcare provider data from County Health Rankings.
This study defines health spending based on KFF’s definition of “spending for all privately and publicly funded personal healthcare services and products by state of residence,” and healthcare access is defined as the number of primary care physicians, dentists, and mental health professionals in each state. All health professional data is positioned per 10,000 residents to allow for clearer comparisons between states.
Key Findings
- The statewide average for healthcare expenditure per person in the U.S. is $10,477. The statewide average for healthcare providers per 10,000 people is 45.3.
- The District of Columbia spends the most at $14,381 per resident. Utah spends the least per person at $7,522.
- Massachusetts has the most healthcare providers at 89 per 10,000 residents. Alabama has the least at 22.8 per 10,000 residents.
State by state, access to healthcare professionals closely aligns with healthcare expenditure. For the most part, residents of states that spend more money on healthcare tend to have better access to care providers, while states with relatively low healthcare spending have fewer healthcare providers per 10,000 people. The more that’s spent on an industry, the more likely it is to offer more options to customers, and healthcare follows a similar track.
When it comes to accessing healthcare, Massachusetts, Alaska, and Washington D.C. have the most healthcare providers per person and the expenditure to match. All three states spend well over $13,000 per resident on healthcare and have over 80 care providers for every 10,000 residents. In all three, increased healthcare spending directly aligns with the presence of more healthcare professionals and providers in the area. By comparison, New Yorkers spend more on healthcare than Alaska and Massachusetts but only have 48 providers per 10,000 residents.
Southern states like Texas, Georgia, and Alabama exhibit the opposite trend, with low healthcare expenditures per state and equally few options when seeking a care provider. Healthcare spending in each state hovers at just under $10,000 per person, with fewer than 30 care providers for every 10,000 residents. Texas, with a population of over 29 million people, had the fourth-lowest healthcare expenditure per resident at only $8,406 and only 25 healthcare providers for every 10,000 residents.
Healthcare woes for Texas continue to worsen as primary care providers become scarcer. In particular, rural areas and places with more at-risk patients in the state are struggling to keep up with the demand for trained physicians and other healthcare professionals. In communities with many high-needs populations, the doctor-to-patient ratio plummets to 1 physician for every 3,000 residents.
States With the Largest Gaps in Healthcare Spending and Access to Healthcare
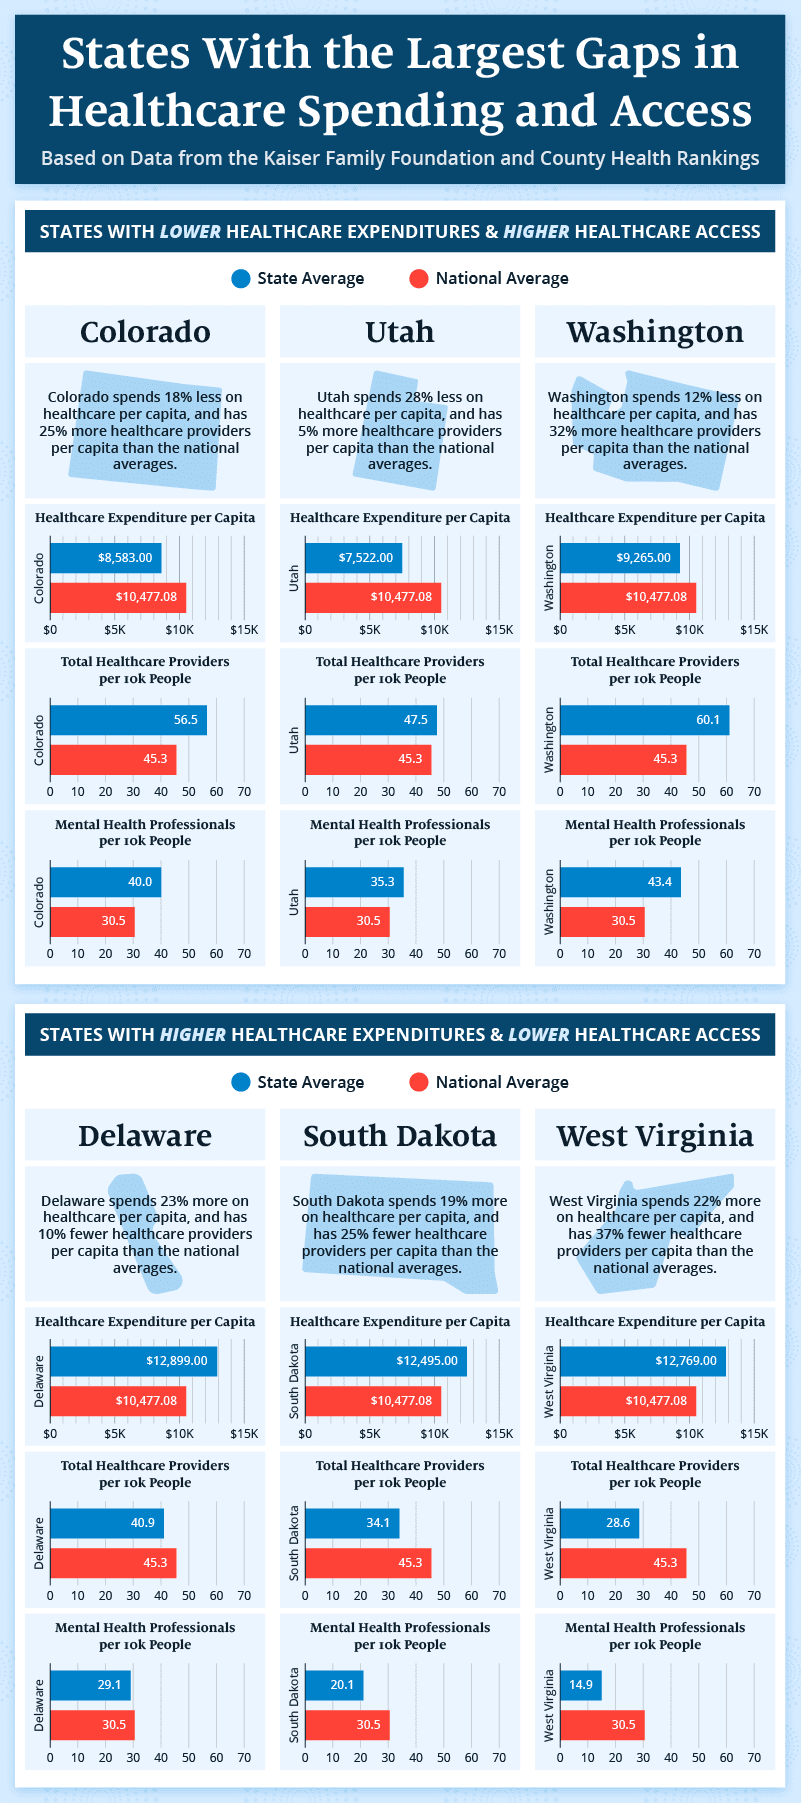
There are a few exceptions to the healthcare expenditure-to-access ratio; three Western states have positive gaps between healthcare spending and access to physicians and other medical professionals. Utah, Washington, and Colorado spend less per resident than the national average on healthcare while having more trained care providers per 10,000 residents.
Utah spends less than any other state on healthcare at just $7,522.00 per person annually. Utah manages to keep its healthcare expenditure at 28% below the national average while averaging nearly 48 care providers for every 10,000 people. Comparatively, Washington state only spends less than 12% below the average on healthcare while having 32% more providers per resident. Colorado balances both by having 25% more healthcare providers and spending 18% less than the nationwide average.
Delaware, South Dakota, and West Virginia are on the opposite side of the spectrum. All three states have higher healthcare costs and limited access to care providers compared to the national average. Each state spends nearly or just over 20% more on healthcare than other areas of the country while having 10% or fewer providers per 10,000 residents on average. West Virginia features the highest disparity of the three, spending 22% more on healthcare costs and having 37% fewer providers per 10,000 people than the national average.
Closing Thoughts
As the cost of living continues to rise in all corners of the country, healthcare is almost guaranteed to follow suit. Some Americans continue to face a perpetual increase in the prices of their day-to-day medical must-haves, while others are struggling to find a primary care provider in the first place. In many cases, healthcare is far from what it should be.
One factor Assurance IQ hopes to eliminate from the equation is the struggle to find the proper health insurance to cover all your medical expenses. If the only thing standing between you and the care you need is an inclusive health insurance policy, our experts are here and ready to help.
Methodology
To determine the states with the largest gaps in healthcare spending and access, we decided to take a closer look at the relationship between the two as a whole. We began by pulling total healthcare expenditures per person by state from the Kaiser Family Foundation (KFF) and healthcare provider statistics per 10,000 people from County Health Rankings (CHR). Once the data was collected, we mapped the two out to see where the greatest discrepancies lie.
The KFF health spending data includes “spending for all privately and publicly funded personal healthcare services and products by state of residence. Hospital spending is included and reflects the total net revenue. Costs such as insurance program administration, research, and construction expenses are not included in this total.”
The CHR data includes primary care physicians, dentists, and mental health professionals by state. All data is positioned per 10,000 residents to allow for clearer comparisons between states.