
According to the International Energy Agency, the share of electric vehicles (EVs) in total sales jumped from about 4% in 2020 to 14% in 2022. As EVs continue to grow in popularity, the landscape of car ownership and maintenance is changing with some states emerging as pioneers in this transition to greener transportation.
To find out more about the regional shifts in accommodations for EV owners, we analyzed factors that would be important for electric car drivers on a local level, like charging infrastructure, active tax incentives, and charging costs. We ranked all 50 states and Washington, D.C. on which would be the best and worst for EV owners as of today.
Table of Contents
Which U.S. States Are the Best for Electric Vehicle Owners?
To find out which parts of the country offer the warmest welcome to electric vehicle drivers, we analyzed several factors that would be important to EV owners, like public charging infrastructure, potential charging costs, and legislation in the form of tax incentives and exemptions. Let’s take a closer look at the states that stand out for EV enthusiasts.
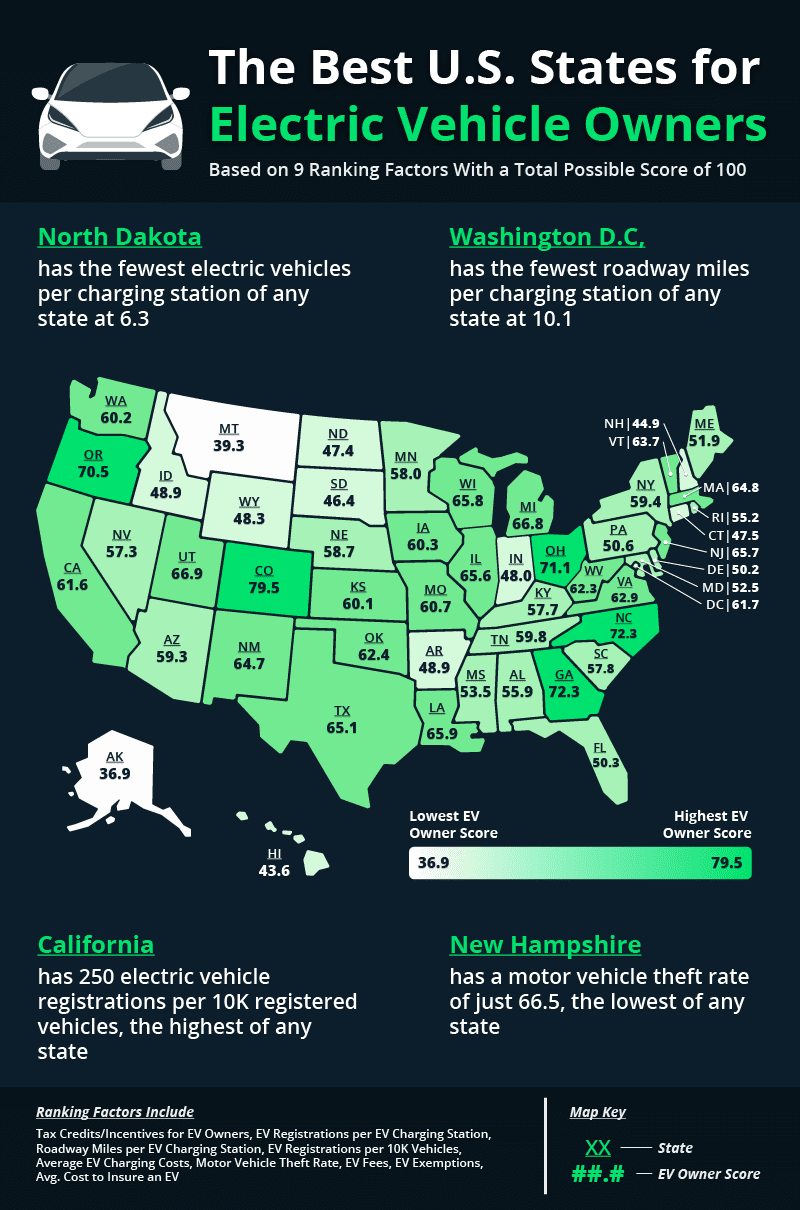
The Best U.S. States for EV Owners
Leading the pack is Colorado, earning a remarkable score of 79.5 out of 100. What makes Colorado stand out? According to data from the Alternative Fuels Data Center (AFDC), the state offers both tax credits and some exemptions for EV owners, and it has 28 EV registrations per charging station, meaning the lines for those charging stations shouldn’t be too daunting.
Coming in at a close second is Georgia, securing a score of 72.3. Georgia impresses with its relatively low charging costs for EVs, averaging at $9.13, compared to the national average of $11.73. Additionally, the state boasts a favorable ratio of roadway miles to EV charging stations, with only 138 road miles per charger, significantly lower than the national average of 371 road miles.
Rounding out the top three is North Carolina, also scoring 72.3. Noteworthy for its relatively low motor vehicle theft rate of 199.3 per 100K residents and offering tax incentives and exemptions for EV drivers, North Carolina proves to be a favorable location for EV owners.
The Worst U.S. States for EV Owners
On the flip side, Alaska and Montana rank as the least favorable states for EV owners, with scores of 36.9 and 39.3, respectively. These states lag behind due to fewer EV owners per registered driver and a lack of active tax incentives or exemptions for those who drive electric vehicles.
Hawaii secures the third spot among the least favorable states for EV ownership, earning a score of 43.6. Challenges such as the absence of tax incentives, high average charging costs (the highest in the study at $29.70), and inadequate public charging infrastructure contribute to Hawaii’s ranking.
States With the Best and Worst Charging Infrastructure
A robust charging infrastructure is essential for making electric vehicle ownership more practical for potential buyers. Let’s delve into some key data points that shed light on the state of charging infrastructure across the U.S.
Electric Vehicles per Charging Station
A state with a lower ratio of electric vehicles to public charging stations means that residents who want to charge their cars likely won’t have to wait in lines that are too long.
National average: 29.4 EVs per charging station
- North Dakota: 6.3
- Wyoming: 7.8
- Maine: 10.5
Road Miles per EV Charging Station
This metric tells the story of EV charging availability on the road. The fewer road miles per charging station means more opportunities to charge for EV drivers.
National average: 371.5 miles per charging station
- California: 26.1
- Massachusetts: 26.4
- Hawaii: 27.5
Electric Vehicles per 10K Registered Vehicles
The number of electric vehicles per registered vehicle tells us how quickly EVs are being adopted in every state. Areas with more EVs on the road are more likely to develop a strong infrastructure for EV drivers.
National average: 62.2 EVs per 10K registered vehicles
- California: 250
- Hawaii: 183
- Washington: 153
Average Cost to Charge an Electric Vehicle
While charging an EV is less expensive than fueling up a gas vehicle, the costs to charge and build. States where charging costs are lower would be better for EV drivers.
National average: $11.73 to charge an average electric vehicle
- North Dakota: $7.30
- Nebraska: $7.55
- Utah: $7.75
Closing Thoughts
While the data points we analyzed only tell part of the story, they do highlight the disparities in charging environments and EV-related legislation across the U.S. They underscore the importance of continued investment in EV infrastructure to make electric vehicles a real option for Americans across the country.
While the number of EVs on the road is growing and charging infrastructure is improving every year, their relative unpopularity can impact those who drive them off the road. EVs can have higher insurance premiums than gas-powered cars because they can be more expensive to repair when in a collision due to sensor-based functions, original equipment requirements, and required additional scans and calibrations.
At Assurance IQ, we understand that drivers of all types of cars require comprehensive auto insurance coverage to safeguard themselves and their vehicles. As the automotive industry continues to evolve, we remain committed to helping you shop and compare policies so you can find one that works for you.
Methodology
To determine the best U.S. states for electric vehicle owners, we ranked all 50 states based on factors that would be important to owners of EVs, like charging infrastructure, electricity costs, and the presence of legislation that positively impacts them.
We assigned weights to each factor depending on how important it would be for an EV owner and, based on those weights, gave a score for each of the nine factors that went into the overall ranking. Every state we analyzed was given a score between 0 and 100, with 100 representing the highest possible score. A full list of our ranking factors can be found below.
Ranking Factor | Source | Weight |
|---|---|---|
Tax Credits/Incentives for EV drivers | 2 | |
EV Registrations per Charging Station | 3 | |
Roadway Miles per EV Charging Station | 3 | |
EV Registrations per 10K Vehicles | 2 | |
Average EV Charging Costs | 3 | |
Motor Vehicle Theft Rate | 2 | |
EV Fees | 2 | |
EV Exemptions | 2 | |
Avg. cost to insure an EV | Assurance IQ Internal Data | 1 |