
Embarking on a road trip across the United States presents an adventure filled with breathtaking landscapes, iconic landmarks, and unforgettable experiences. However, seasoned travelers know that the cost of the journey can vary dramatically depending on your route.
Additionally, accidents or unexpected breakdowns can turn an exciting trip into a stressful ordeal, emphasizing the importance of reliable auto insurance that keeps you covered in any state. Whether you’re plotting a cross-country adventure or frequently find yourself behind the wheel for interstate commutes, Assurance IQ is your go-to resource for securing an auto insurance policy that meets your needs and budget.
We analyzed the costs of driving through each state to aid travelers in making their road trip plans. Discover which states will stretch your travel budget the furthest according to gas prices, fuel taxes, electricity costs, and the annual mileage per driver in the U.S.
Table of Contents
The Most & Least Expensive States to Drive Through
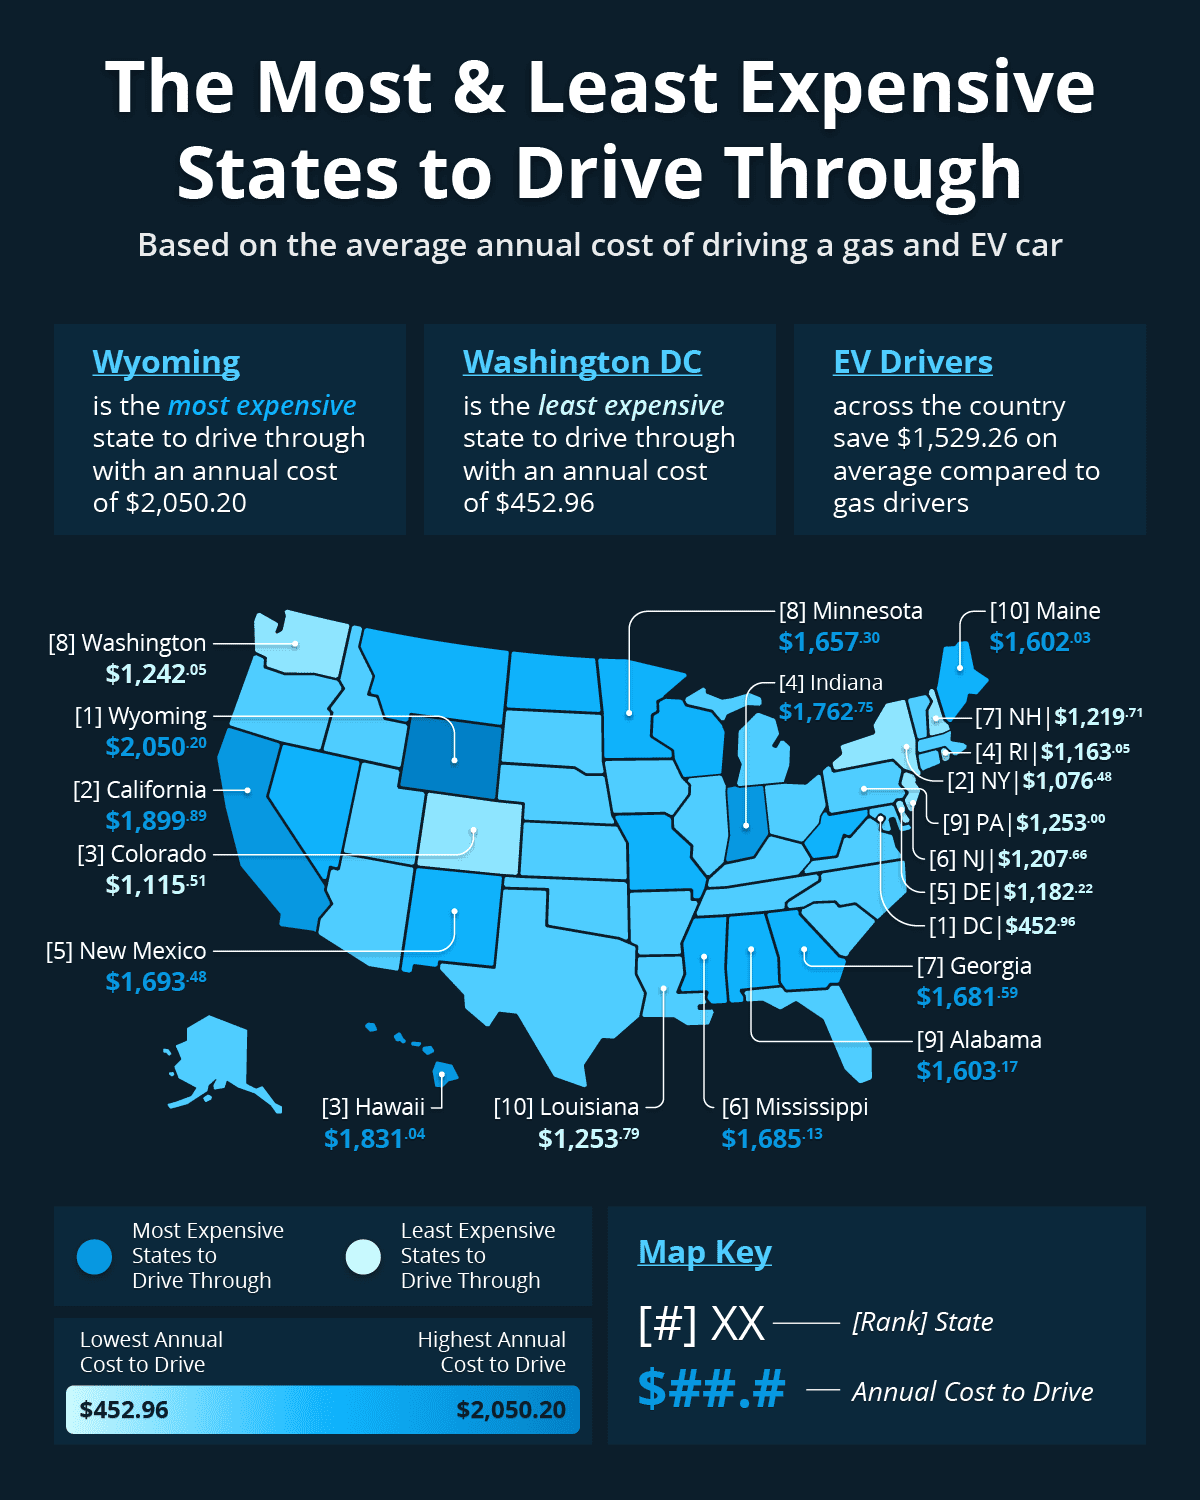
The most affordable state to drive in is the District of Columbia, where drivers may spend as little as $452.96 annually. At less than one-third of the national average ($1,422.05), the capital of the U.S. is certainly one of the most cost-effective states to add to a road trip. This is largely due to its low mileage at under 5,000 annual miles per driver on average.
Conversely, Wyoming is where the annual cost skyrockets to $2,050.20. It is the priciest state for motorists thanks to the state’s high annual mileage per driver (24,069). With such spread-out towns connected by long highways, mileage costs rise quickly.
California, Hawaii, and Indiana round out the top of the most expensive list with prices exceeding the national average by more than $300. Meanwhile, states like New York and Colorado keep prices lower, enabling cost-effective tourism and vehicular travel to their illustrious views and bustling cities.
Interestingly, more than half of the most affordable states to drive through are in the Northeastern U.S. With smaller state sizes and lower overall costs, road trips up North are the best for American wallets. On the other hand, the West and South have the most states in the top 10 most expensive states. Plans to visit those regions will require a larger budget for travel.
The Cost Difference Between Gas & Electric Vehicles
Overall, riding in an electric vehicle is the most budget-friendly option. For EV drivers, the national average is $657.42 for a year’s worth of charging, while the national average cost for gas drivers is $2,186.68. However, it is important to remember that charging stations are generally more sporadic and time-consuming than gas stations. Regardless, the cost disparity between the two varies greatly from state to state.
The states with the lowest costs for EV drivers are the District of Columbia ($234.29), Washington ($343.80), Oregon ($438.38), Nebraska ($448.35) and Idaho ($477.49). For reference, the national average cost of use specific to electric vehicles is $657.42, solidifying these states as good options for an EV road trip.
For gas-powered vehicle owners, the District of Columbia ($671.63), Rhode Island ($1,447.53), New York ($1,499.02), New Hampshire ($1,613.78), and Colorado ($1,709.89) are the best options. While those prices are much higher than the costs for electric vehicles, they’re still considerably lower than the national average cost of $2,186.68 for gas cars.
In some states, the difference between the cost of electric vehicles and gas vehicles is a huge gap. Wyoming is the pinnacle of this disparity, with a whopping $2,559.98 saved by driving electric vehicles instead of gas-powered vehicles. Comparatively, the District of Columbia only has a difference of about $437.34, which is still a pretty penny, but much less of a disparity than Wyoming’s prices. Regardless, the national average amount saved by driving electric vehicles over gas cars is $1,529.26, a compelling argument for making the switch.
Closing Thoughts
Road trips are one of the most fun ways to experience the authentic beauty of a state while also maintaining the freedom to design the itinerary. However, various costs must be considered with trip goals and budget restrictions. It may be worth looking into the cost of electric vehicle driving compared to gas-powered vehicles to get the most bang for your buck.
To avoid shelling out even more cash on the road, collision insurance is a good option for financial protection in the case of an accident. At Assurance IQ, we can help you find an auto insurance plan to accommodate your travel plans, whether you’re venturing across the country or sticking to your state.
Methodology
The annual cost to drive through each state is based on the average annual mileage of drivers in every U.S. state, according to data from the DOT. We considered the average cost of driving a mile in an EV, based on the cost of charging an EV in every state (using electricity data from the EIA), divided by the typical mileage of an EV at full charge. We also considered the average cost of traveling a mile in a gas car by analyzing the cost of a gallon of gas as of March 2024 (AAA) divided by an average of 25 miles per gallon.