
While car collisions can impact people of all ages, younger drivers are impacted at a higher rate.
In 2020, teen drivers accounted for an average of 8 fatal accidents every day, according to the Centers for Disease Control and Prevention (CDC). The CDC also determined that 16 to 19 year olds experience fatal car accidents at a rate almost three times higher than any other age group due to factors such as inexperience, speeding, distractions, inconsistent seatbelt use, and drug and alcohol usage.
To shed light on the importance of safety behind the wheel for younger drivers, we explored the rate of serious accidents involving young drivers vs. older drivers in every U.S. state.
Table of Contents
U.S. States With the Most Serious Accidents Involving Young Drivers
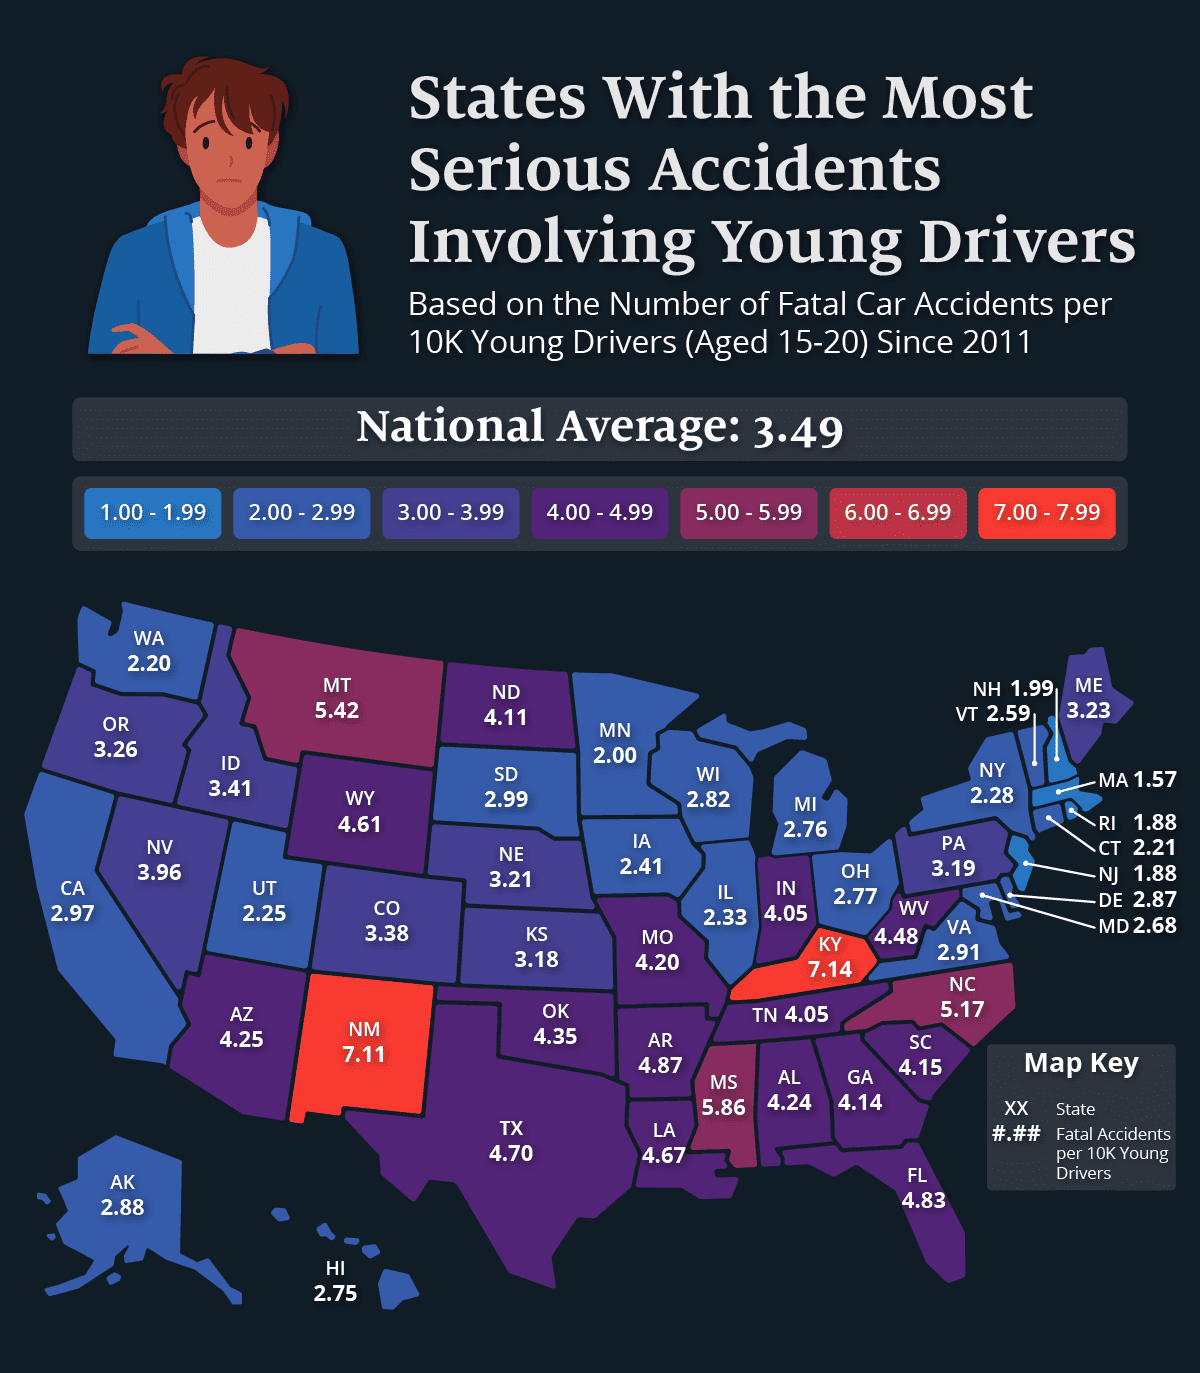
We collected 10 years of state fatal accident data by age and positioned it against the number of licensed drivers in each state by age to determine the rate of serious accidents involving young drivers.
Kentucky, New Mexico, Mississippi, Montana, and North Carolina average more than 5 fatal accidents per 10,000 young drivers annually. It is notable that all of these states are known for having large rural populations.
This indicates the higher accident rate could be tied to a lower population density that allows drivers to travel at faster speeds, as well as an increased need to travel by car due to the distance between destinations. The narrow, curvy roads with low visibility that can be found in rural areas may also be a contributing factor.
On the other hand, Massachusetts, Rhode Island, New Jersey, New Hampshire, and Minnesota average less than 2 fatal accidents per 10,000 young drivers annually.
Of these, the majority are located in New England and are known for having more urban areas, leading to a higher population density and increased traffic congestion that require drivers to travel at slower speeds. The potential for walking or taking public transportation to their desired destinations could also contribute to the lower fatal accident rates.
Although these are the states that stood out, it is important to keep in mind that serious car accidents can occur anywhere.
Comparing Serious Accidents of Teen and Adult Drivers
Although teen drivers in the U.S. tend to be involved in serious car accidents at higher rates than adults, adult drivers are still at risk. According to the National Safety Council, the risk of being involved in a fatal car accident begins to decrease after age 34; however, the rate begins to increase again with drivers aged 75 or older due to changes in vision, hearing, and mobility.
That being said, how do teen driver accidents compare to adult driver accidents in each state? We’ve compiled some key insights below.
States With the Highest Percentage of Fatal Accidents Involving Young Drivers
- Utah (16.1%)
- Nebraska (15.8%)
- Idaho (15.2%)
- Kansas (15%)
- Iowa (14.4%)
States With the Lowest Percentage of Fatal Accidents Involving Young Drivers
- Hawaii (10%)
- Maryland (10.1%)
- New York (10.3%)
- Massachusetts (10.7%)
- New Jersey (10.8%)
The earlier trend of population density potentially playing a role in these rates also prevails here. Young drivers in more spacious Central and Western states are more often involved in serious accidents than those in more compact Northeastern states.
Closing Thoughts
No matter what age group someone belongs to, they are at risk of being involved in serious car accidents every day they are on the road. We may not be able to control other drivers, but we can foster safe driving habits by taking steps to protect ourselves. For information on how auto insurance can help protect you and your loved ones, visit Assurance IQ.
Methodology
To find out more about the relationship between age and serious car accidents across the U.S., we pulled fatal car accident statistics by motorist age from the U.S. Department of Transportation’s National Highway Traffic Safety Administration from 2011 through 2021. We positioned this data against the total number of licensed drivers (per 10,000) in each state from the Federal Highway Administration.
In this study, “young drivers” references drivers 20 years or younger. “Older driver” or “adult” refers to those 21 years or older.