

According to a survey conducted by Indeed, roughly 45% of people move for long-term career prospects or a new job offer. When deciding on where to live, workers must weigh the pros and cons between living out in the suburbs and experiencing a longer commute or living closer to work, thereby saving on commuting expenses.
With this dilemma in mind, the Assurance IQ team wanted to find the true cost of commuting, including both the financial and time burden. To do so, we analyzed statewide average commuting data to find the states where residents who drive to work spend the most on their commute. These expenditures factor in additional costs like gas and car insurance – the latter can go up if you have a long commute because it increases your time on the road.
We then found the mean commuting times for people living in some of the fastest-growing U.S. suburbs to see how much of their weeks are spent going to and from work. This data should help you determine whether a long commute in your state is worth it and remind you of the importance of auto insurance for a safe commute if the unexpected happens.
Table of Contents
U.S. States That Spend the Most on Their Commute to Work
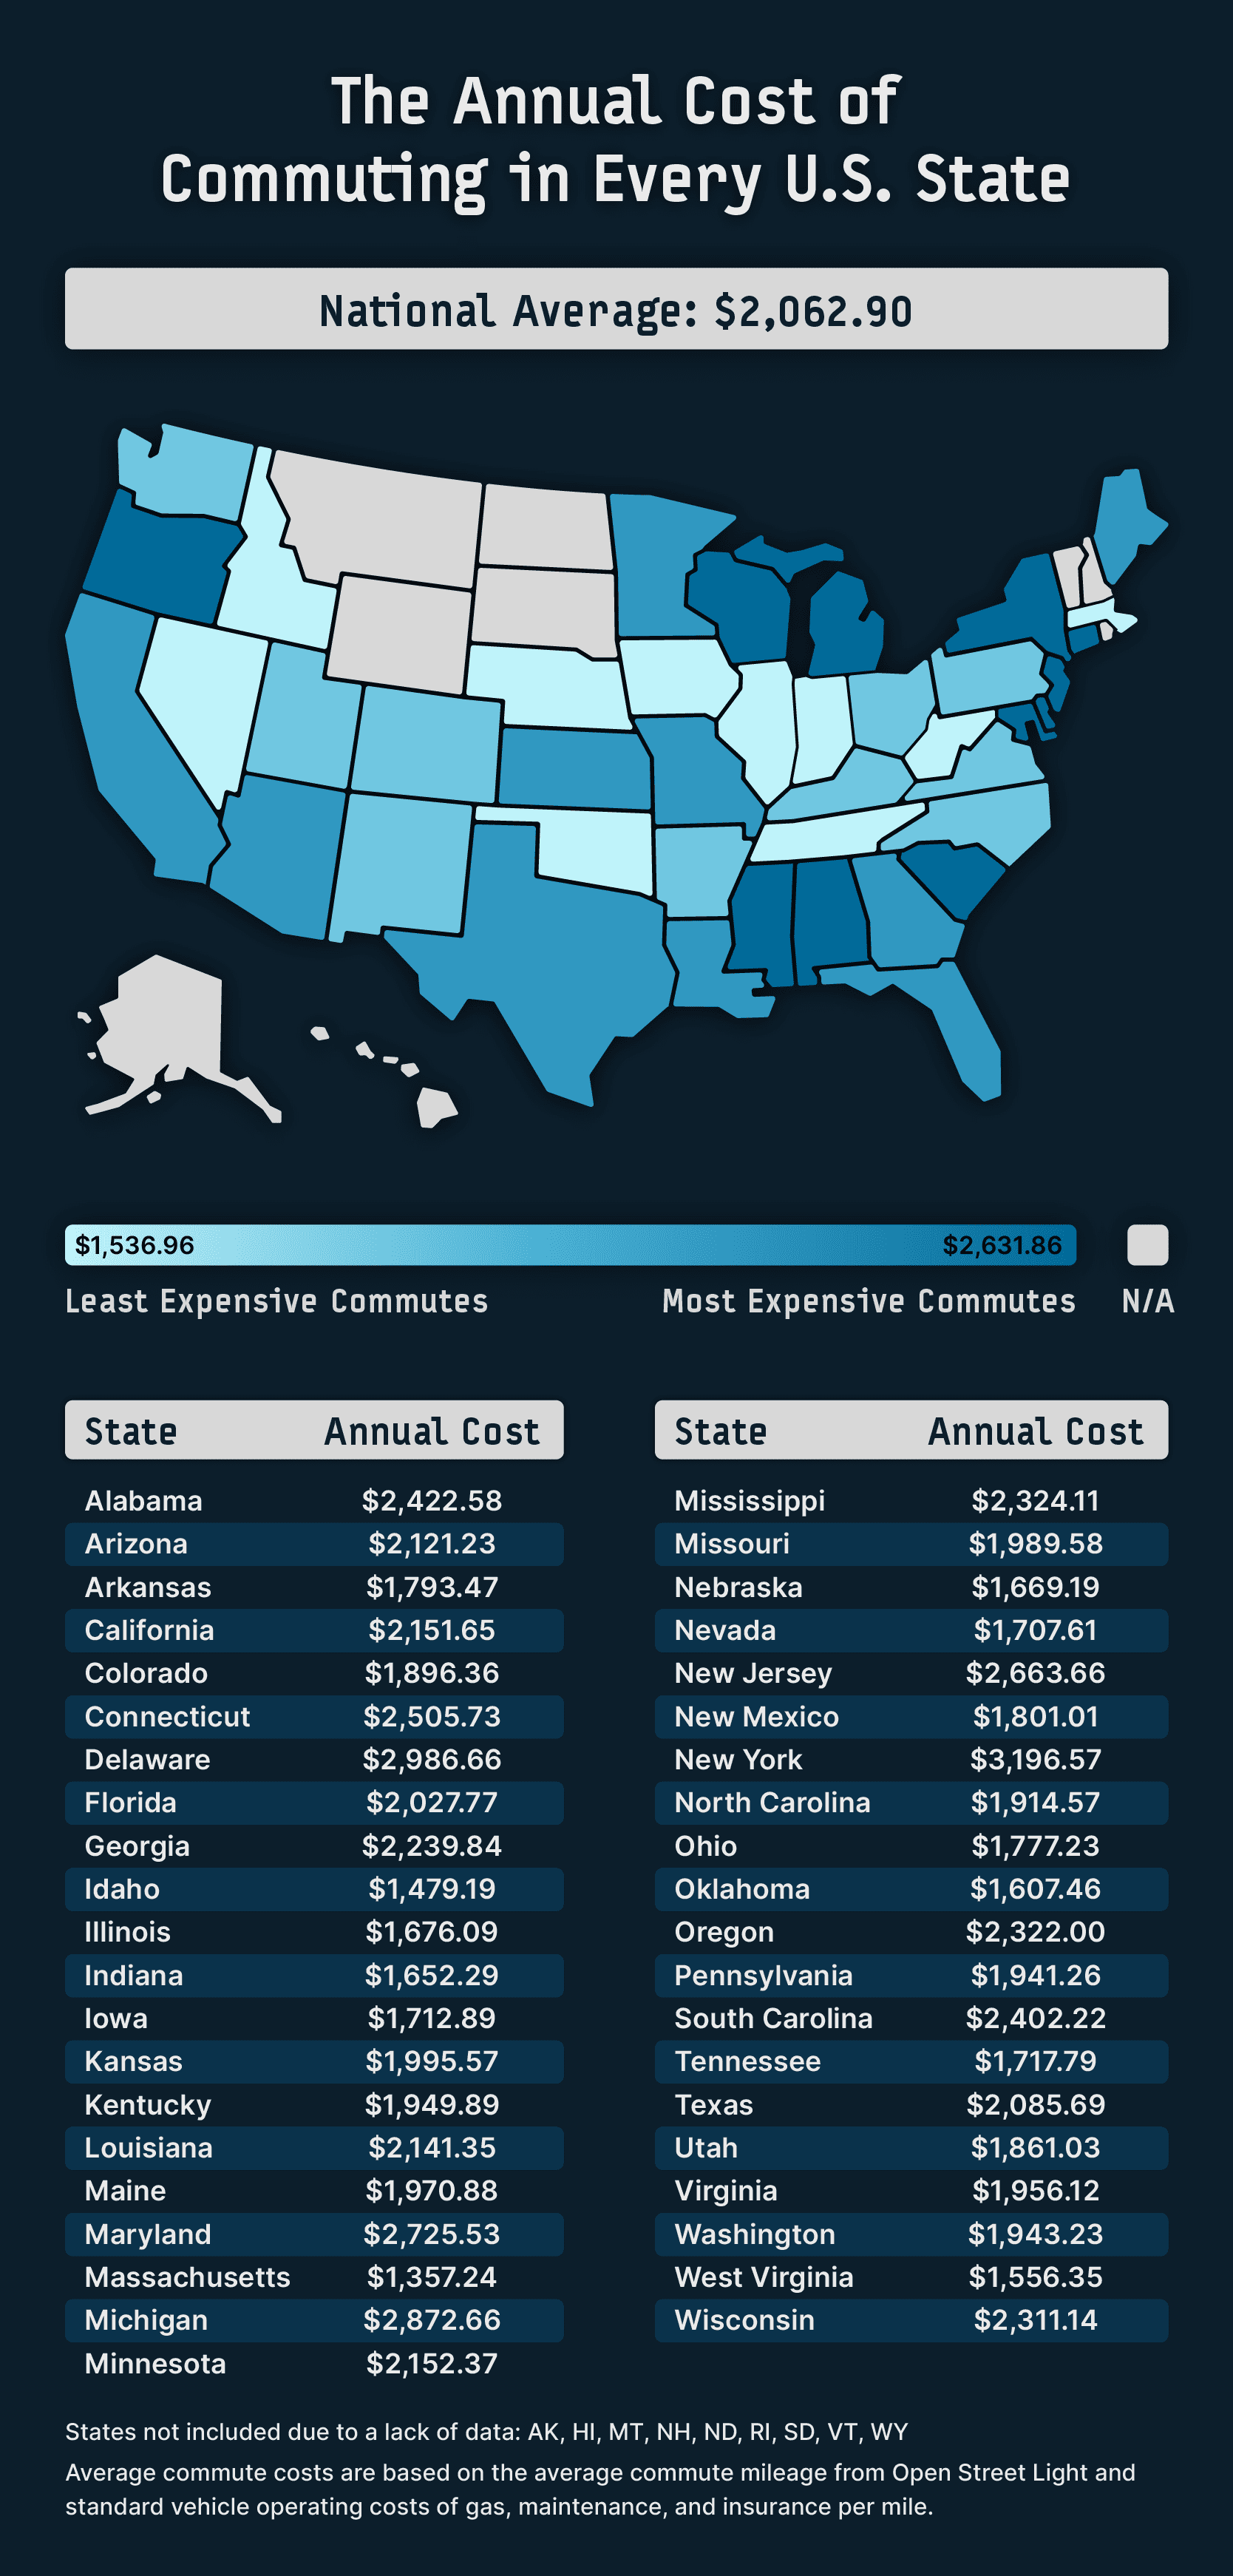
Over three-quarters of American commuters drive their own car to work every day. That means that in states where average commute distances are longer, personal travel expenses like fuel, maintenance, and insurance can really add up for drivers.
Using data from the U.S. Census Bureau on median household income, we calculated the annual commute cost for drivers as a percent of annual income. We also excluded the following states due to insufficient data: AK, HI, MT, NH, ND, RI, SD, VT, and WY.
New Yorkers spend the most on commuting annually at $3,197, which accounts for 4.3% of their median income ($74,314). Roughly one million commuters come in and out of the city each day for work with some commuters traveling over 90 minutes or more each day.
Delaware residents have the second-highest annual commute cost at $2,987, which accounts for 4.2% of residents’ median income ($71,091). Those in Delaware have an average monthly insurance cost of $236.00 and monthly car payment of $533.00.
Following slightly behind is Michigan, where residents experience an annual commuting expense of $2,873, or 4.5% of the median household income ($63,498).
Additionally, Mississippians have the highest commuting expenses as a percentage of their income, spending $2,324.11 annually, or 4.8% of the state’s median income ($48,716). While Mississippi has an average gas price of $2.99 per gallon, residents have a high monthly car payment of roughly $600.00 and spend $1.53 on car maintenance every day.
On the other hand, people from Massachusetts spend the least on commuting as a percentage of their income, spending $1,357 annually or 1.5% of the statewide median income ($89,645). Residents in Massachusetts spend roughly $67.00 per month on insurance and have an average monthly car payment of roughly $482.00.
Idahoans only spend $1,479 annually or 2.2% of the state’s median household income ($66,559) on commuting costs. Idaho residents have a monthly insurance cost of $160.44 and an average gas price per gallon of $3.29.
West Virginia is another state that enjoys low annual commuting costs at $1,556, which is only 3% of its median income ($51,248).
The Time Cost of Commuting in Growing Suburbs Around the U.S.
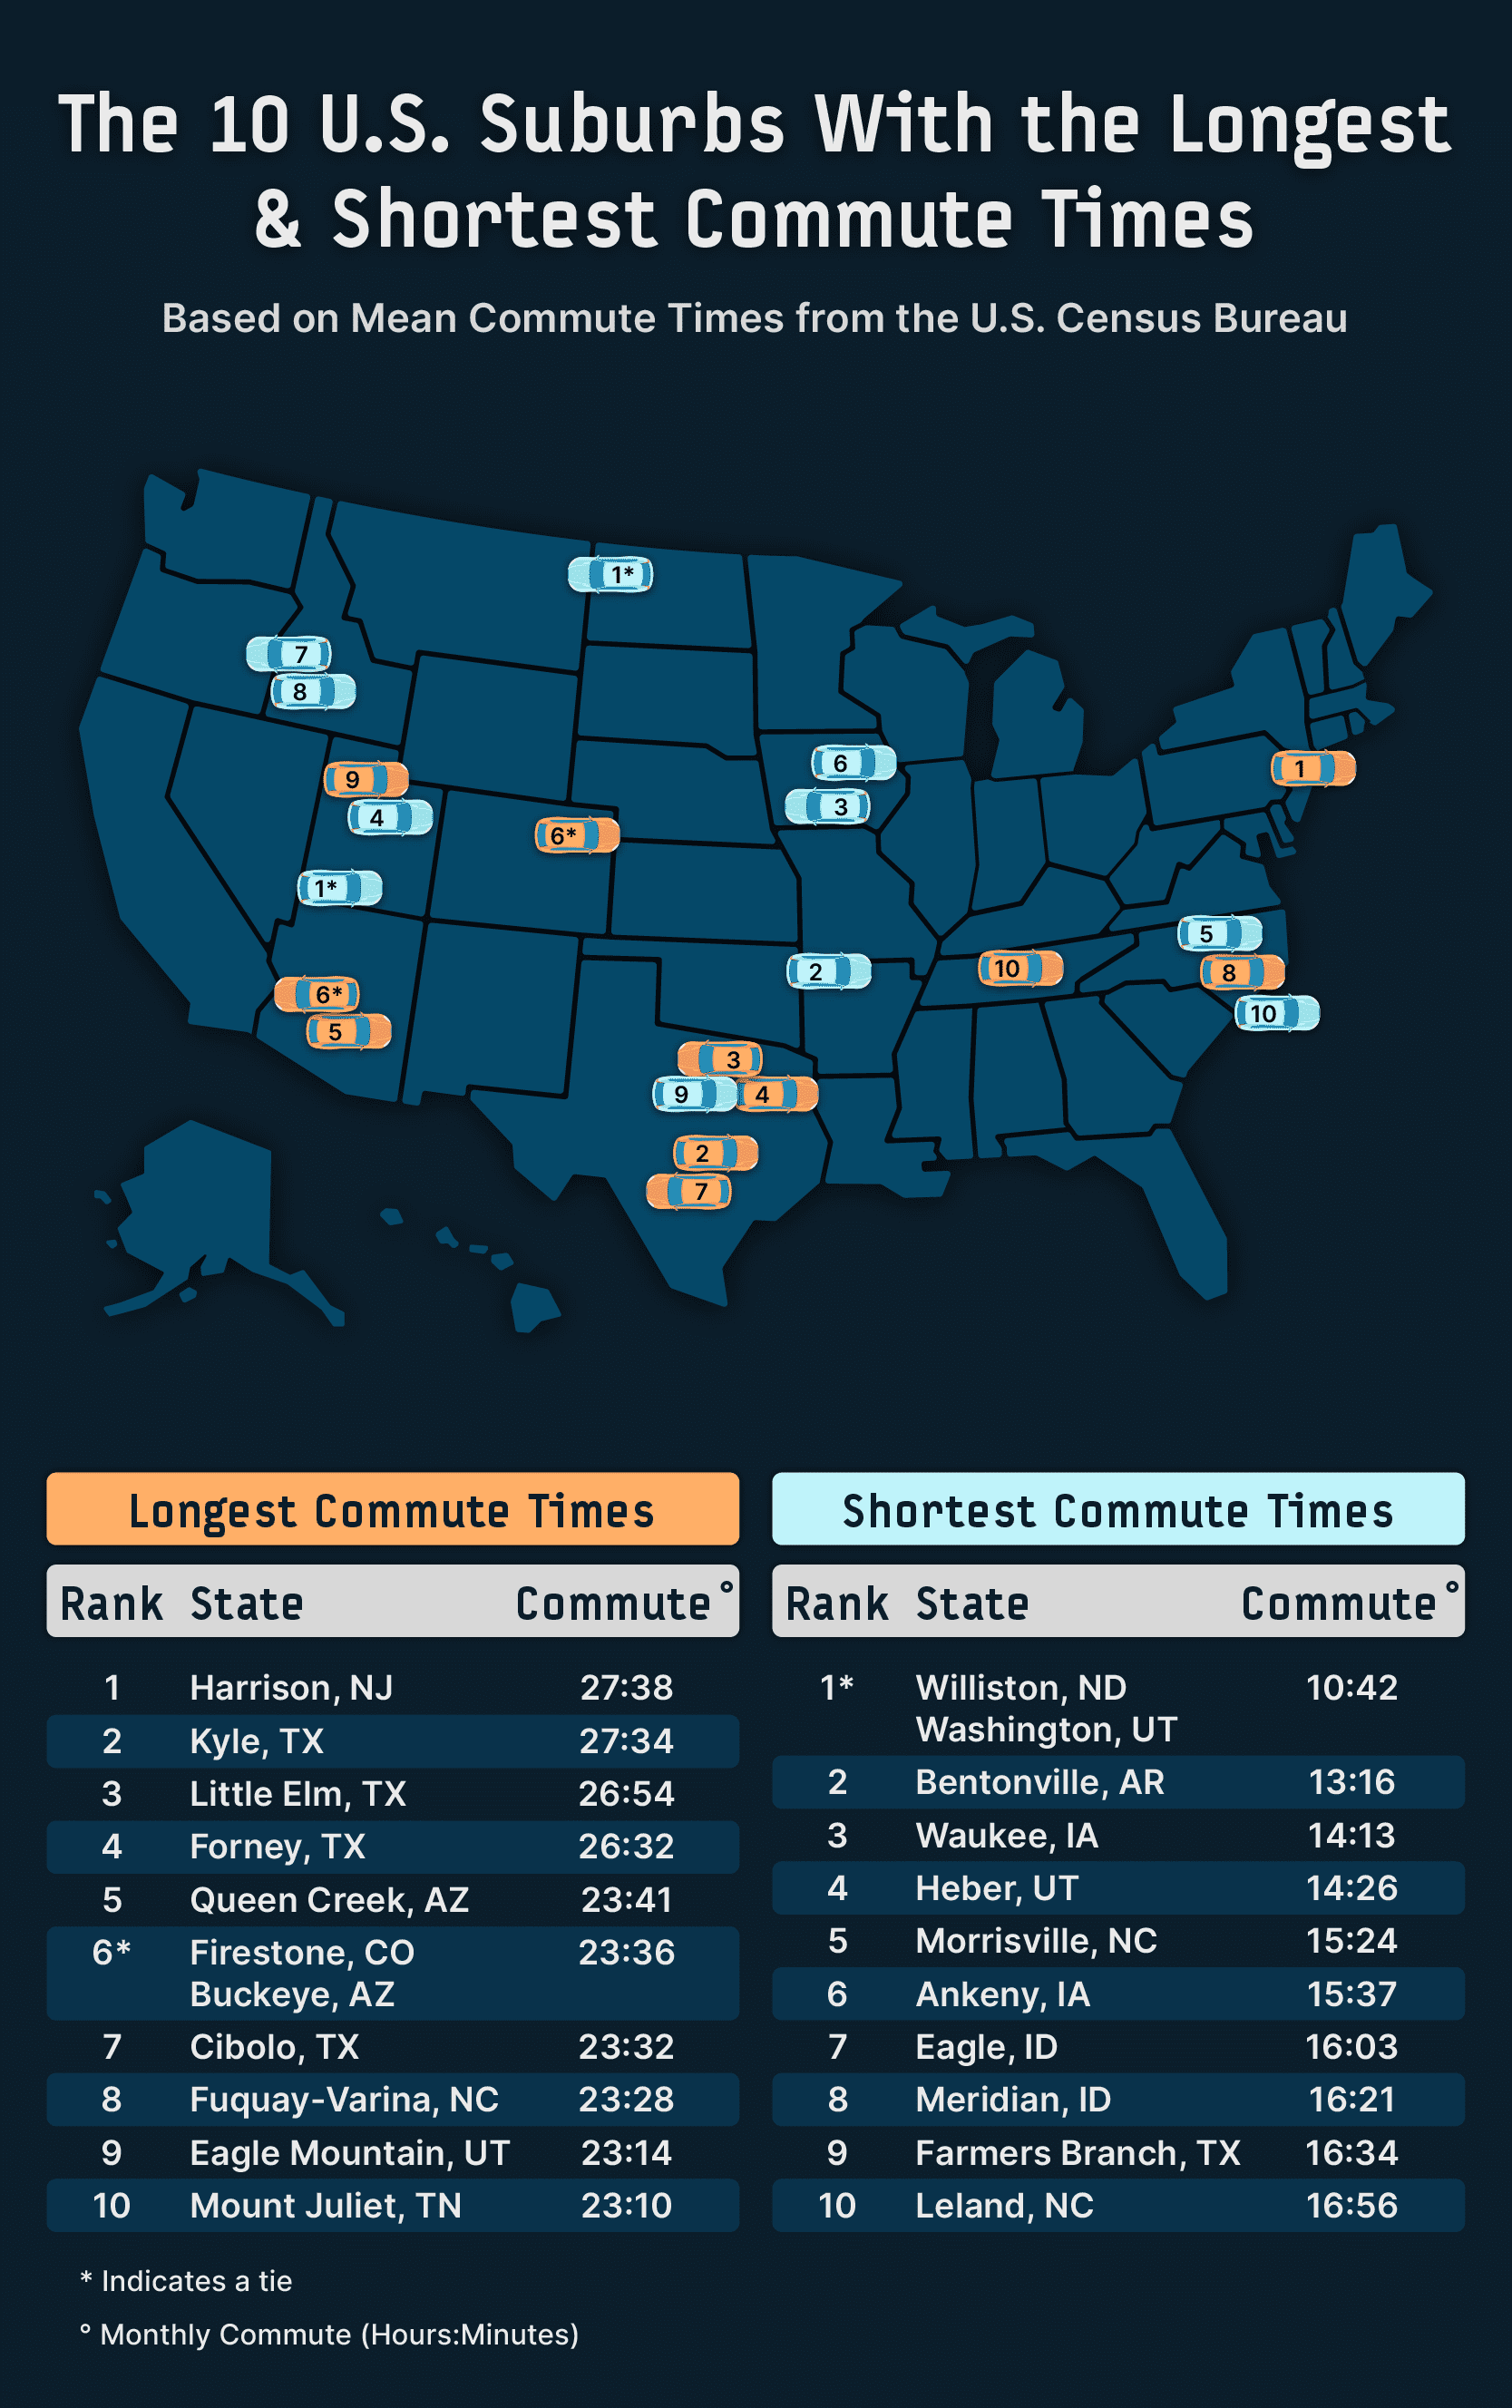
With roughly 74% of Americans commuting to work every day, we wanted to analyze the time cost of commuting in some of the fastest-growing suburbs around the U.S. This time cost does not only impact those who drive in to work, but also those who utilize public transportation for part or all of their workplace journey.
Residents of Harrison, NJ, have the longest commute in the country, with residents spending an average of 75 minutes and 24 seconds on their commute, which amounts to 1 year and 9 months over a commuter’s lifetime. Harrison is popular for commuters due to its proximity to New York with some commuters taking the PATH train into the city daily.
Kyle, TX, and Little Elm, TX, follow closely behind with a daily commute of 75 minutes and 12 seconds and 73 minutes and 24 seconds, respectively. Both commutes amount to over 13 days annually.
Residents in other suburbs have a much shorter commute time. Both Williston, ND, and Washington, UT, have a daily average work commute of 29 minutes and 12 seconds which only amounts to 8 months over a lifetime.
Bentonville, AR, has a daily commute of 36 minutes and 12 seconds which amounts to 13 hours and 16 minutes every month. Bentonville has on-demand transit services at zero charges where residents can easily schedule a ride through an app.
Waukee, IA, also boasts a short daily average work commute of only 38 minutes and 48 seconds, or roughly 7 days annually. Commuters in Waukee can take advantage of two modes of public transportation, including HIRTA and DART, which has Express Route 92 for downtown Des Moines commuters.
Closing Thoughts
Our study sheds light on the cost of commuting, including the financial costs associated with long commute times as well as the time burdens that come with commuting from the suburbs to work.
With plenty of people commuting every day, it’s important to prepare for the unexpected. Assurance IQ can help you shop and compare different auto insurance rates and find a policy that works for you.
Methodology
To determine the cost of commuting in every state, we found the average distance people in every state travel to work and used that as a starting point to price out gas, maintenance, and insurance costs on a daily basis. We sourced data on commuting distances from Street Light Data, gas costs and maintenance estimations from AAA, and car insurance data from internal Assurance records.
We then found out the time cost of traveling to work in different suburbs around the U.S. using mean travel to work data from the U.S. Census. These time cost assumptions are based on the average commute time in each suburb, taken out to monthly, annual, and lifetime figures. The lifetime time cost figures are based on 47 working years (18-45 years old).