

As demand for housing increases and housing inventories dwindle, a phenomenon known as bidding wars is sweeping the nation. In November 2023, 62% of properties on the market sold in less than a month, according to the National Association of Realtors. This arena of offers and counteroffers is escalating, meaning that understanding what cities bidding wars rage in could mean the difference between securing your dream home or facing the frustration of missed opportunities.
In such a competitive market, home insurance becomes crucial for new homeowners, providing protection against unforeseen damages and offering financial security for their significant investment.
To find out which cities have the most bidding wars, we analyzed factors such as listing prices and actual sale prices. We compared sale-to-list ratios across major U.S. cities to find where homes were selling above and below the asking price and where bidding wars were most and least likely.
This analysis not only helps in understanding the competitive landscape but also underlines the importance of securing a comprehensive home insurance policy to safeguard your new home in these high-stakes environments.
Table of Contents
Which Cities Consistently Sell Homes Above or Below The Asking Price?
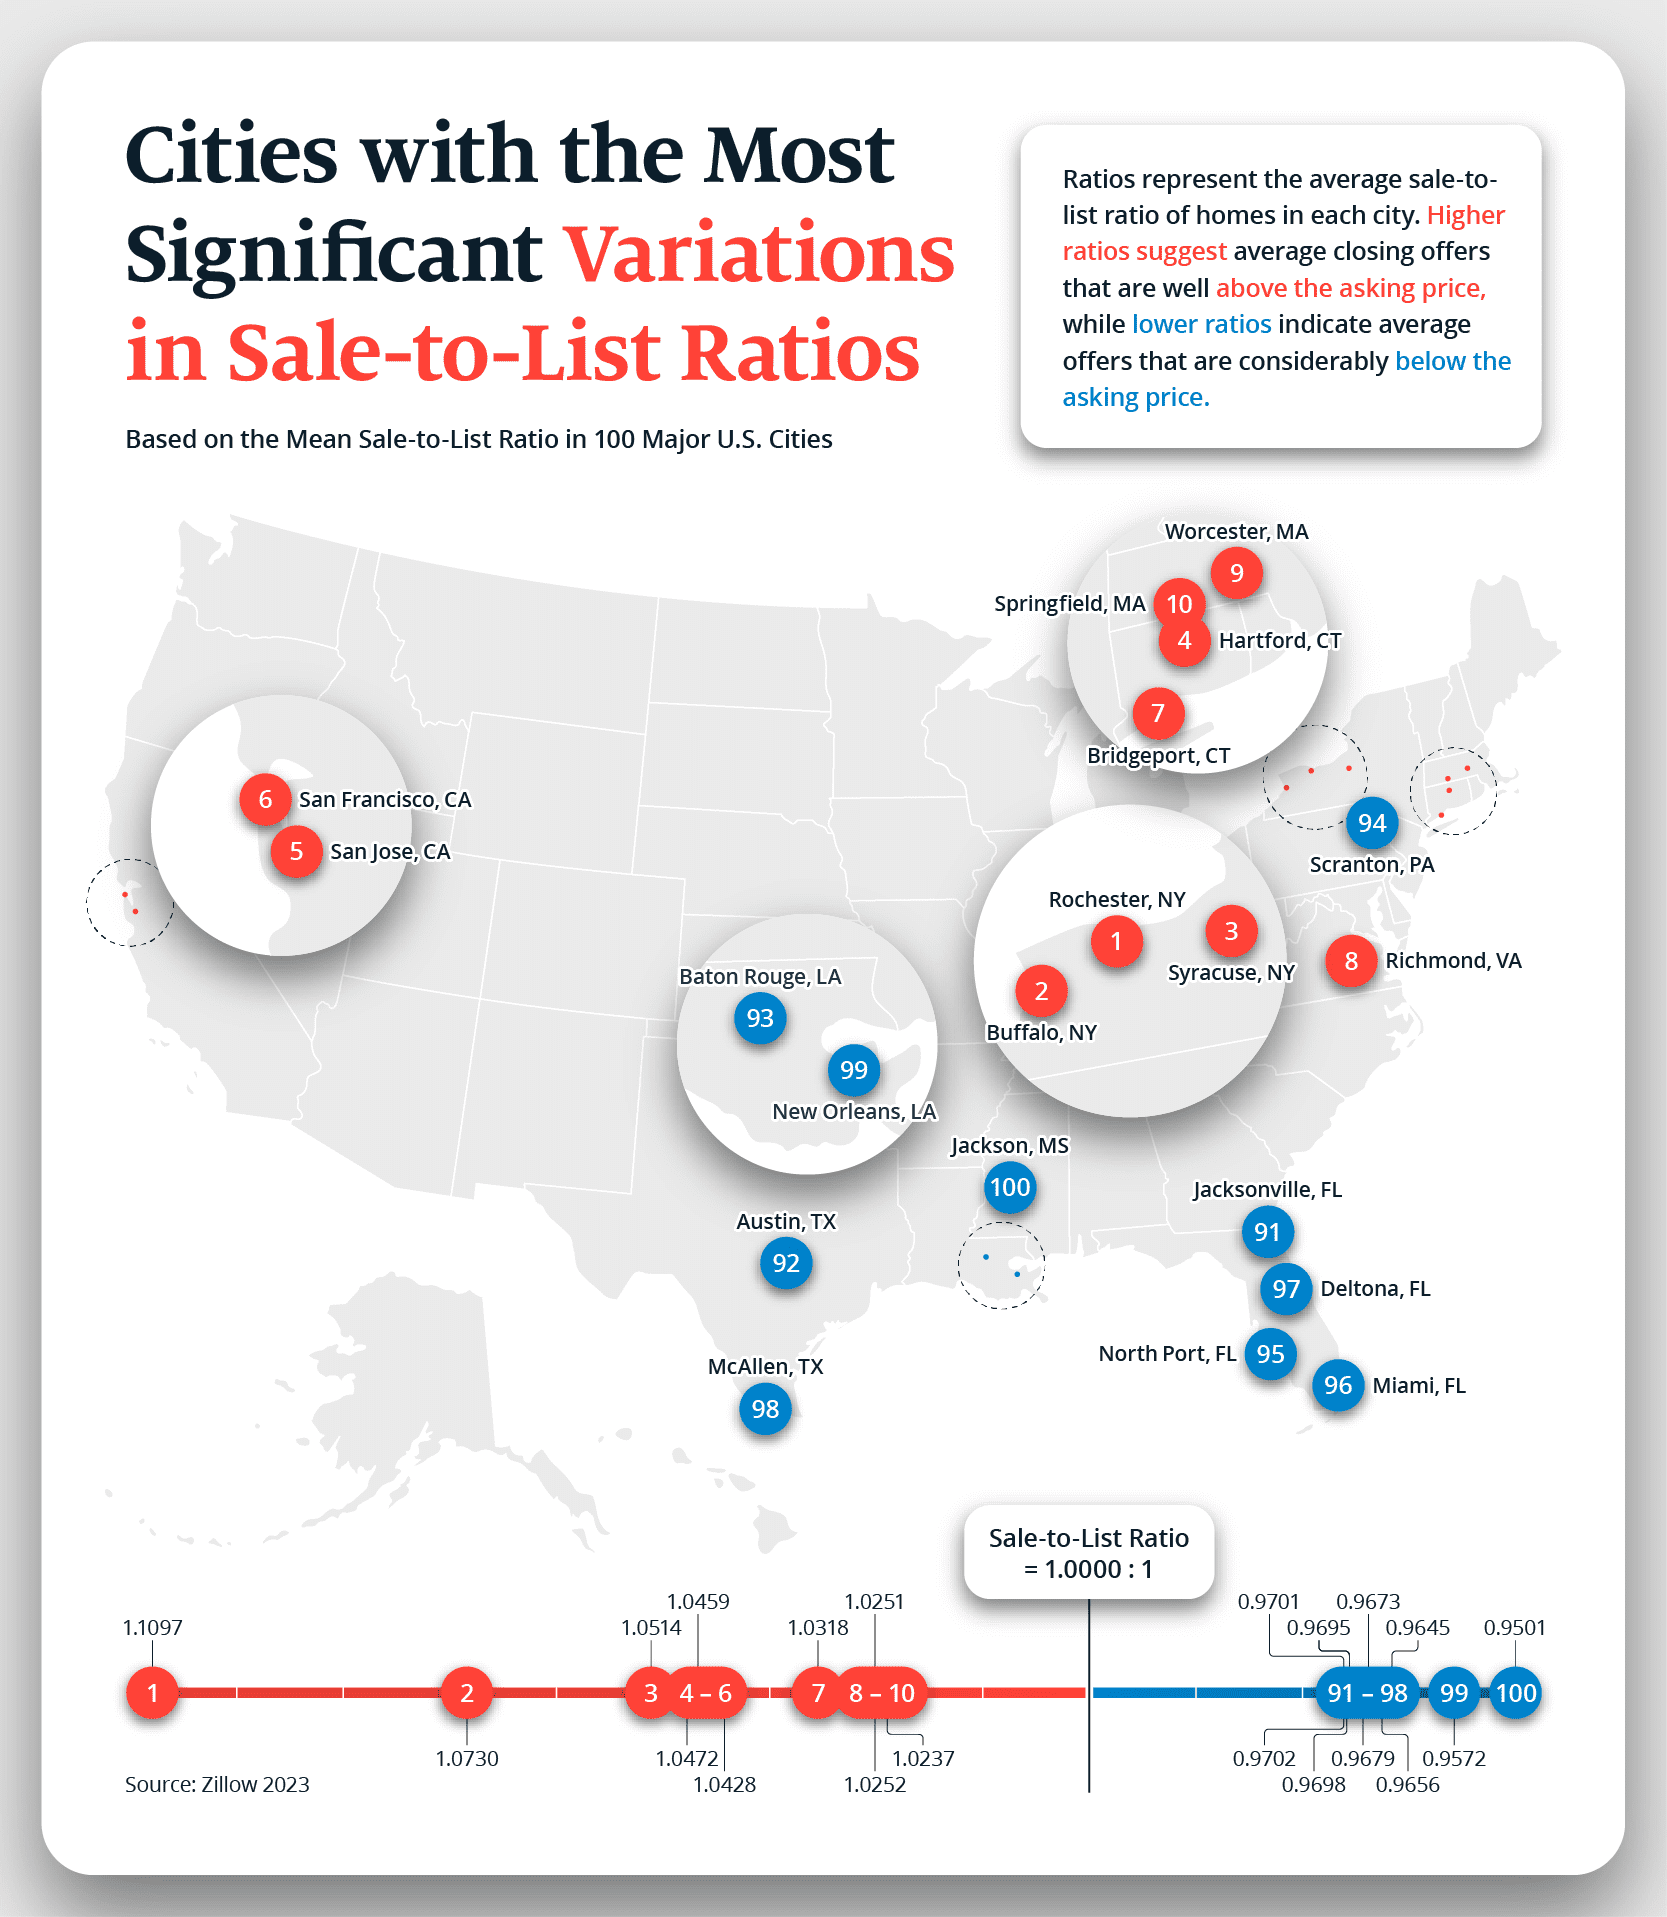
The real estate landscape varies across cities. In some cities, homes often sell for more than the asking price, while in others, there is more room to negotiate. For our study, a sale-to-list ratio of 1:1 indicated that the average home sells for the same as the asking price. Higher ratios mean homes are selling above the asking price, while lower ratios indicate homes are selling below the asking price. For reference, the national average ratio across the top 100 cities, according to Metropolitan Statistical Area (MSA) data, is 0.9949.
When we dove deeper into our data, we discovered that 27 cities have an average sale-to-list ratio exceeding 1:1, meaning that on average, homes in these cities sell above the asking price. Cities like Rochester, NY (1.110), Buffalo, NY (1.073), and Syracuse, NY (1.051) were at the forefront, with higher closing offers than their initial listing prices. These cities were all in New York, where housing is often difficult to find and can be expensive.
On the other hand, 73 cities had a ratio below 1.1, where homes were sold below the asking price. Among these cities, Jackson, MS (0.950), New Orleans, LA (0.957), and McAllen, TX (0.964), had closing offers the lowest below the asking price. Four of the cities among the top 10 cities with offers the lowest below the asking price were in Florida (Deltona, Miami, North Port, and Jacksonville). In December 2023, Florida had a 16.4% increase in homes available for sale compared to the previous year, according to Redfin.
Cities with Closing Offers the Highest Above Asking Price (Ratio (X:1))
- Rochester, NY (1.110)
- Buffalo, NY (1.073)
- Syracuse, NY (1.051)
- Hartford, CT (1.047)
- San Jose, CA (1.046)
- San Francisco, CA (1.043)
- Bridgeport, CT (1.032)
- Richmond, VA (1.025)
- Worcester, MA (1.025)
- Springfield, MA (1.024)
Cities with Closing Offers the Lowest Below Asking Price (Ratio (X:1))
- Jackson, MS (0.950)
- New Orleans, LA (0.957)
- McAllen, TX (0.964)
- Deltona, FL (0.966)
- Miami, FL (0.967)
- North Port, FL (0.968)
- Scranton, PA (0.969)
- Baton Rouge, LA (0.970)
- Austin, TX (0.970)
- Jacksonville, FL (0.970)
Here’s How Much a $400k Home Would Sell For in Your City
U.S. cities have a wide range of average sale-to-list ratios, providing insight into varying competitiveness in real estate markets. To put this in perspective, we compared how much a $400,000 house sold in the city with the highest sale-to-list ratio in our study (1.110) to the lowest sale-to-list ratio (0.950).
Several cities in Texas had closing offers relatively lower than the asking price. McAllen (0.964), Austin (0.970), and San Antonio (0.970) were some of these cities. Texas often has abundant available land and a greater housing supply, which could be why closing offers are relatively lower than the asking price in these cities.
Cities in California placed higher on the scale of sale-to-list ratios. San Jose, San Francisco, Los Angeles, Oxnard, San Diego, and Sacramento were above the national average ratio and in the top thirty for the highest sale-to-list ratio. This could be due to a limited housing supply in California. According to Redfin, the share of Redfin offers that faced bidding wars in November of 2021 was 72% for San Diego, 68.4% for San Francisco and San Jose, and 67.5% for Sacramento, which were among the highest percentages.
Closing Thoughts
Securing comprehensive home insurance is essential for those lucky enough to purchase a home below the asking price. It ensures that the value of their property is safeguarded, accounting for potential repairs, renovations, or replacement costs that may be required to bring the home up to standard. On the other hand, for buyers in cities where homes consistently sell above the asking price, understanding the insurance implications of a competitive market is equally vital.
Buyers need to assess how rising property values can affect their insurance coverage needs and explore options to protect their investments against unexpected market fluctuations. It’s important to note that while the sale price of a home doesn’t directly influence home insurance premiums, it can indirectly affect them. Inventory, interest rates, and local market trends, among a whole host of other factors, can influence whether a home will sell above or below asking.
Whether you’re in the market for a new home or looking to protect your current residence, Assurance IQ is here to guide you through the complexities of home insurance, helping you make informed choices to safeguard your investment and secure your financial well-being.
Methodology
To identify where real estate competition is, we explored cities where properties consistently sell well above or below their listed prices. Utilizing Zillow’s comprehensive datasets, we analyzed the average sale-to-list price ratio for homes across the top 100 MSAs. A ratio above one suggests homes are selling for more than the asking price, while a ratio below one indicates they’re going for less. Our focus was on cities with the most extreme ratios, revealing where closing offers typically deviate most significantly from the listed prices. The analysis reflects the latest available data as of October 2023.