
Edmunds recommends allocating no more than 15% of your monthly paycheck towards a new car payment; however, affordability depends on numerous factors beyond the monthly car payment. What’s more, the cost of gas is soaring daily, and car insurance is a necessary expense that adds up. In this piece, we will analyze state-by-state data to answer the question: how much of our paychecks are being eaten by our rides?
The U.S. States Spending the Most & Least
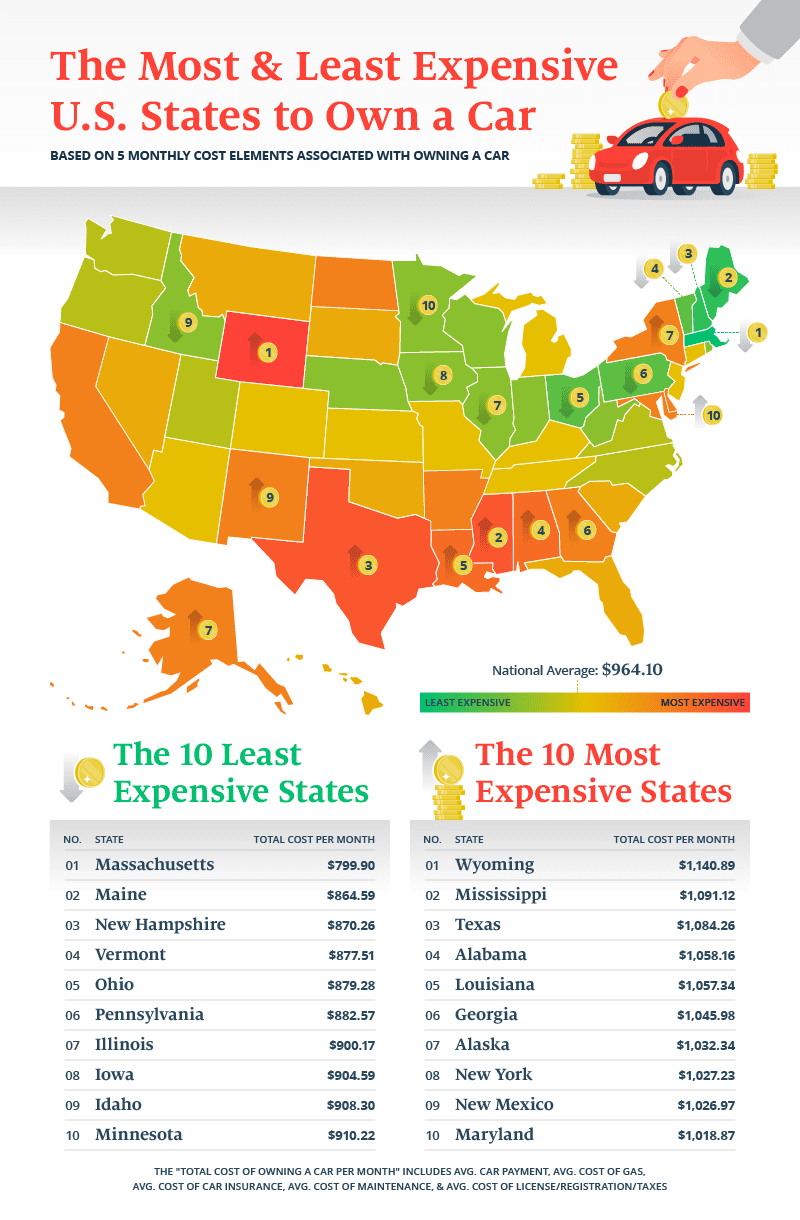
Wyoming is the most expensive state to own a car, with $1,140.89 spent monthly on average. Not only does Wyoming have the second-highest average monthly car payment at $636.00, but residents also have to drive more than in any other state to get to where they are going.
On average, people in Wyoming drive a little over 1,900 miles monthly. When you factor in gas, insurance, and other expenses, Wyomingites spend 20% of their monthly paycheck on their vehicles alone.
Everything is bigger in Texas, including car notes. Texas has the highest average monthly car payment out of any state in the U.S. at $662.00, before factoring in fuel and insurance. Unfortunately for residents who want to avoid buying a car altogether, Texas is the second-largest state in the country, making it challenging to get around without one.
Every year, Texans drive 260 billion miles – second only to California. Thankfully, drivers in Texas find some relief at the pump, as the state has the lowest gas prices nationwide at $3.00 per gallon.
The top four cheapest states to own a car are in New England, with Massachusetts leading the charge. The average cost of owning a vehicle in Massachusetts is $799, or only 11% of most people’s average monthly income.
Part of this is due to the state’s incredibly reasonable insurance rates; on average, residents in Massachusetts only pay $67.00 monthly to insure their vehicles. People in Massachusetts also drive far less than Southern drivers at 913 miles monthly, meaning they do not have to worry about gas prices as much.
Percent of Your Paycheck Toward Your Car
One of the charms of Southern living in the U.S. is the vast expanses of open land. Unfortunately, for many people living there, that also means putting more money toward a car. The majority of people putting 20% or more of their paycheck toward their vehicle expenses are overwhelmingly in the South, with Mississippi topping that list.
Mississippians devote almost 27% of their monthly income to keeping their cars on the road. On average, people in Mississippi spend $206.53 monthly on gas and cover more than 1,600 miles per month, second only to Wyoming in driving mileage. Nevertheless, the median household income in Mississippi is approximately $49,000 – almost $20,000 less than Wyoming’s. Consequently, the increasing costs of owning and maintaining a car appear to disproportionately impact people in rural areas.
States with more walkable cities and metropolitan areas fare better when it comes to car expenses. For instance, New Yorkers only allocate about 16% of their monthly income to their cars. On average, residents in New York drive far less than those in other corners of the country at only 700 miles monthly. Even with staggering car insurance prices (nearly $286.00 monthly for many residents), New Yorkers still save a fortune at the pump by being able to get to places on foot.
Closing Thoughts
As we’ve seen through our analysis of state-by-state data, the financial burden of owning a car varies widely depending on where you live. It’s critical to remember that car affordability depends on many factors, including average salaries in different regions. For some individuals, spending more on a car may be unavoidable due to their financial situation.
The monthly car payment isn’t the only consideration; ongoing expenses such as gas, maintenance, and insurance can also add up quickly. It’s important to approach car ownership with a realistic understanding of your budget and financial situation to avoid unnecessary stress and difficulty later on.
Auto insurance is just one piece of the puzzle, and with so many options available, it can be challenging to know you are getting the best rate possible. Assurance IQ can help you compare affordable auto insurance options to pick the coverage that fits your needs and budget.
Methodology
To determine the percentage of the paycheck spent on owning a car in each state, we collected data on the average cost of gas, the number of miles traveled annually and the number of licensed drivers in each state, median household income, and the average miles per gallon for a car. We used sources such as AAA for the average cost of gas, internal data for the average cost of car insurance, and the Federal Highway Association for the number of miles traveled annually and number of licensed drivers.
Using the data we collected, we calculated the monthly average cost of owning a car in each state, which includes the cost of gas, car insurance, maintenance, license/registration/taxes. We then divided this by the median household income in each state to determine the percentage of the paycheck spent on owning a car. All data was collected in February 2023.