
According to data compiled by the National Highway Traffic Administration (NHTSA), there were roughly 31,785 deaths due to car crashes in the first 9 months of 2022 alone. While roadway fatalities seem to be leveling out compared to recent years (there were 38,824 total fatalities in 2020), this statistic is still highly unsettling.
This prompted the Assurance IQ team to take a closer look at the most dangerous times to drive in every state, including the specific days of the week and the most dangerous hours of the day to be on the road. We sourced fatal car accident data from the NHTSA and looked at factors like the number of licensed drivers and roadway miles in each state, according to data provided by the Federal Highway Administration (FHWA).
We hope that this research sheds light on the importance of staying safe on the road and investing in a comprehensive auto insurance plan to minimize financial losses associated with car accidents.
Which Days of the Week Have the Most Fatal Car Accidents?
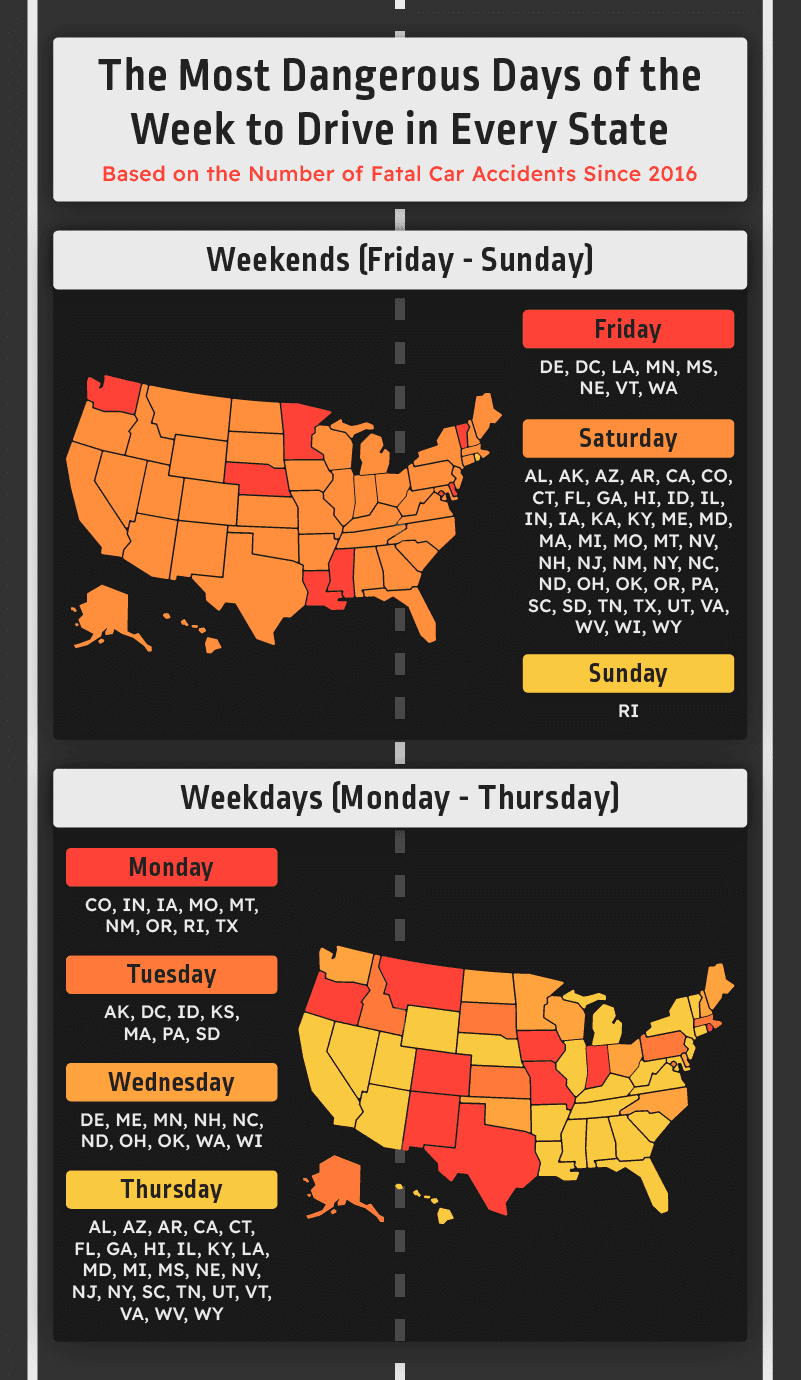
In this study, we analyzed fatal car crash data to determine the most dangerous days for drivers during the weekend (Friday through Sunday) and during the week (Monday through Thursday).
Unsurprisingly, the weekends were the most dangerous days to drive across all states, with Saturday putting drivers the most at risk. Saturday was the deadliest day for 42 states, including California, which had 2,982 car accident fatalities on Saturdays since 2016, and Texas, which had roughly the same at 2,926.
Sunday is the most dangerous day for drivers on the road in Rhode Island with 50 fatal car crashes occurring on Sundays while Friday was the most dangerous day to drive for 8 states, including Delaware (102 fatalities), Minnesota (284 fatalities), and Washington (435 fatalities).
The weekdays (Monday through Thursday) fared slightly better odds for drivers with Thursday being the worst and deadliest for 25 states, such as Hawaii (72 fatalities), New Jersey (395 fatalities), West Virginia (187 fatalities), and Georgia (957 fatalities).
Tuesday was the safest day to drive during the week with only 7 states experiencing high rates of fatalities. States like Pennsylvania (702 fatalities), Idaho (147 fatalities), and Arkansas (337 fatalities) experienced the highest rates of car crash deaths on Tuesday, excluding the weekend.
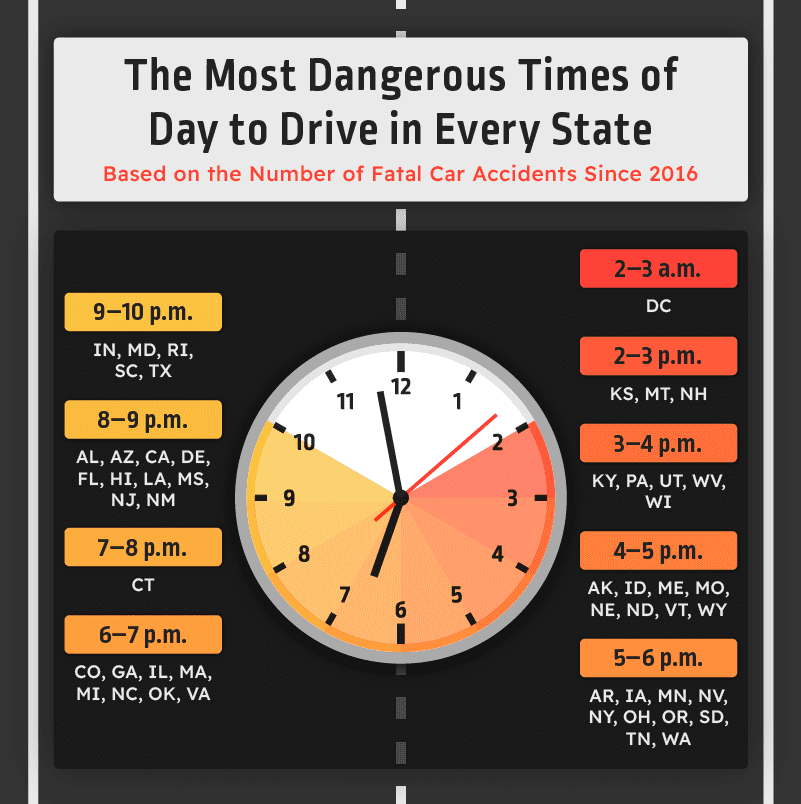
The Most Dangerous Hours of the Day to Be on the Road
Most Americans are familiar with safe driving PSAs that warn against the dangers of distracted or incapacitated driving, including texting while driving and driving under the influence.
But no matter the cause of such car crash fatalities, it’s clear that certain times of the day are more dangerous for driving than others.
Both 5-6 p.m. and 8-9 p.m. were equally dangerous for 10 states each. The after-work rush (5-6 p.m.) was the most hazardous for states like Iowa (117 fatalities), New York (286 fatalities), and Tennessee (306 fatalities) while 8-9 p.m. was the worst time to drive in places like Florida (1,061 fatalities), Mississippi (199 fatalities), and New Mexico (131 fatalities).
Both 4-5 p.m. and 6-7 p.m. tied for the second most dangerous times to drive for 8 states each. States like Alaska (22 fatalities), Missouri (259 fatalities), and Vermont (23 fatalities) fared the worst from 4-5 p.m. while states like Colorado (187 fatalities), Massachusetts (104 fatalities), and North Carolina (419 fatalities) had the highest amount of fatal crashes from 6-7 p.m.
7-8 p.m. was the least dangerous time on the road overall, except for Connecticut drivers. In comparison, the early morning hours between 2-3 a.m. and mid-afternoon hours between 2-3 p.m. were the most dangerous for three states each.
U.S. States With the Most Dangerous Drivers
To determine the states with the most dangerous drivers, we looked at factors like the number of fatal accidents for every 10,000 licensed drivers to gain a bird’s eye view of which states are more dangerous to drive in based on population.
We also calculated the number of fatal accidents per 1,000 miles of roadway to determine the most dangerous states to drive by area.
When it comes to fatal accidents solely, states like Mississippi (3.41 fatal accidents per 10k drivers), Arkansas (2.72 fatal accidents per 10k drivers), and Wyoming (2.61 fatal accidents per 10k drivers) are home to some of the most unsafe drivers.
This is followed by states like New Mexico (2.48 fatal accidents per 10k drivers) and South Carolina (2.46 fatal accidents per 10k drivers).
When examining your chances of getting into an accident based on the miles of roadway, Florida is one of the most dangerous states with 11.21 fatal accidents per 1,000 miles of roadway. The District of Columbia ranks second with 9.86 fatal accidents per 1,000 miles of roadway and is followed by California with 8.97 fatal accidents.
Dangerous Times to Drive
What are the most dangerous days, hours, and months to drive in your state? Find your state in our table above for a holistic picture of the most hazardous times to be on the road.
Closing Thoughts
Driving during different days of the week and hours of the day pose varying risk levels. While many might assume that the early morning hours lead to more car crash fatalities, evening hours are actually more dangerous to be out on the road.
But while you may not be able to avoid driving at certain times of the day, you shouldn’t avoid getting auto insurance, which is especially helpful in the event of a car crash. At Assurance IQ, we provide ways for you to compare auto insurance quotes and find a policy that works for you.
Methodology
We determined the most dangerous times to drive in every state by analyzing data available from 2016 from the National Highway Traffic Safety Administration on fatal car accidents. Using this information, we were able to find the most dangerous days of the week and hours of the day for drivers across the country. As collisions are more likely to occur on the weekend, we found the most dangerous days for drivers on both the weekends and during the week.
We also determined the most dangerous states to drive in, based on the number of fatal accidents that occurred in 2020. We positioned the data per 10,000 drivers and per 1,000 miles of roadway to allow for a more accurate comparison. The number of licensed drivers and miles of roadway figures were sourced from the Federal Highway Administration.